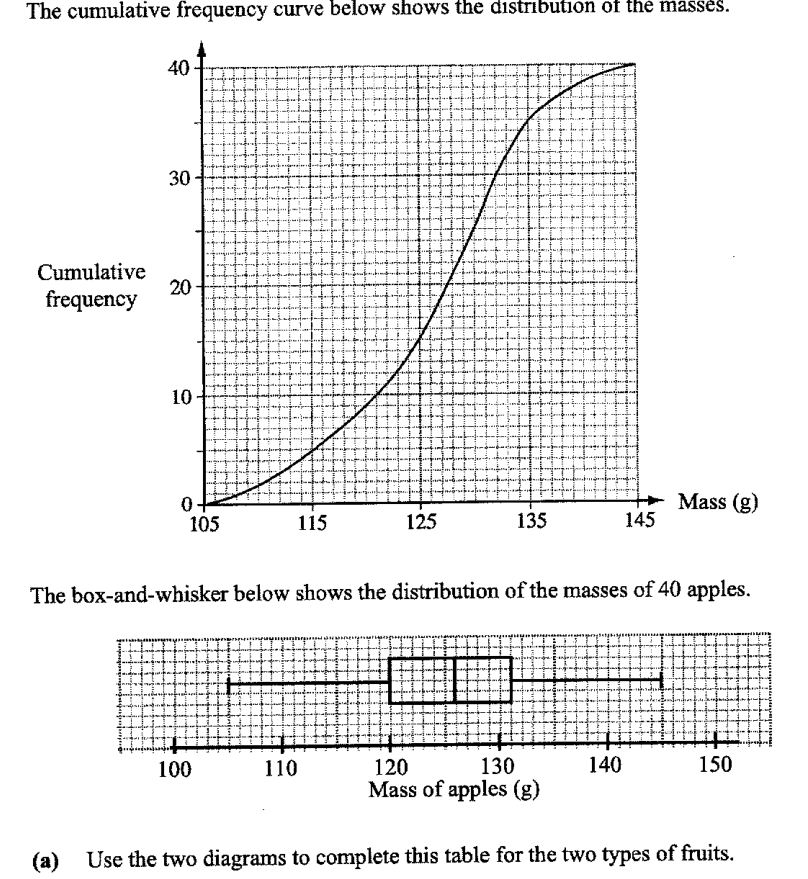
测量了 40 个橙子的质量。 下面的累积频数曲线显示了这些质量的分布。
- ((a))
使用这两张图表来完成这两种水果的表格。
-
类型 下四分位数 中位数 上四分位数 四分位距 橙子 g g g 11 g 苹果 g 126 g g 11 g
-
- ((b))
描述苹果的累积频数曲线与橙子的累积频数曲线可能有什么不同。
- ((c))
下面是比较橙子和苹果质量分布的两句话。
对于每句话,写出“对”或“错”。给出每个答案的理由,并清楚地写明你做出决定时使用的是哪些统计量。
- ((i))
苹果比橙子重。
... 因为 ...
... 因为 ...
- ((ii))
比 131g 重的橙子比例高于苹果。
... 因为 ...
... 因为 ...
- ((i))
- ((d))
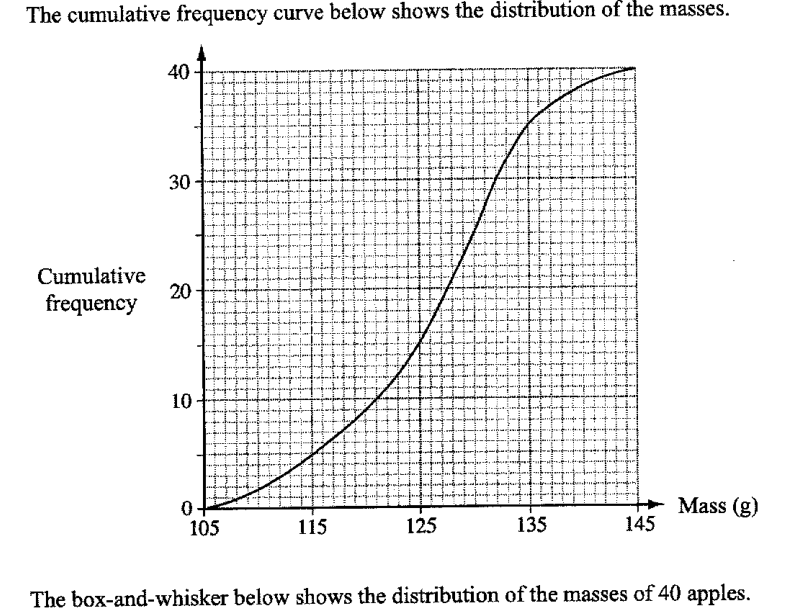
橙子质量的分组频数表如下所示。
- ((i))
计算平均质量的估计值。
答案 ... g
- ((ii))
计算标准差的估计值。
答案 ... g
- ((iii))
随机抽取 2 个橙子(不放回)。
计算其中至少有一个橙子质量至少为 125 g 的概率。答案 ...
- ((i))
它不会直接告诉你答案,而是问你卡在哪一步看看 AI 是怎么陪你一步步弄懂这道题的
完整解法
10((d))((i))
1. Find the class midpoints and compute the estimated total mass.
Class midpoints:
2. Divide by the total frequency to estimate the mean.
Total frequency
g
10((d))((ii))
1. Use class midpoints and the estimated mean to calculate the estimated standard deviation.
Class midpoints: .
Using the estimated mean from part (d)(i), ,
g
10((d))((iii))
1. Find the number of oranges weighing at least 125 g and less than 125 g.
From the table,
Number weighing at least g .
Number weighing less than g .
2. Use the complement of 'at least one' and calculate the probability without replacement.
AI 分析,可能出错
用 AI 批改,圈出写错的那一步,并自动将你的薄弱点存入错题本,形成你的错因库。
同一知识点的其他题
- 1对 A、B 两家工厂生产的两批各 400 根钢条的质量进行了测量和记录。下方的累积频数图像显示了这些质量。 对于工厂 A 生产的钢条,求 中位数。 答案 ... kg 四分位距。 答案 ... kg 工厂 B 生产的钢条比工厂 A 生产的钢…
- 2茎叶图显示了某班男生和女生的测试成绩。 [茎叶图印刷为两列,左列标为“男生”(Boys),右列标为“女生”(Girls),共用中间的一列茎。键(男生)8 | 3 表示 38。键(女生)4 | 1 表示 41。] 艾尔文在下方的箱线图中表示了…
- 3该累积频数图展示了某一天在餐厅 A 消费的 60 名顾客在接受服务前的等待时间(以分钟为单位)的分布。 利用该曲线估计: 中位数等待时间, 答:... min 四分位距, 答:... min 等待时间的第 35 百分位数。 答:... mi…
- 4两家电话服务店(A 店和 B 店)各 40 名顾客的等待时间 t(单位:分钟)如下。 计算 A 店的平均等待时间。 答:___ 分钟 解释为什么你对 (a)(i) 的回答只是一个估计值。 答 ... 计算 A 店的标准差。 答:___ 分钟…
- 5某一天班上 18 名女生的体温显示在下面的茎叶图中。 (茎叶图显示在下方并在 figure_description 中重现。) 键:37 | 1 表示 已知极差为 …