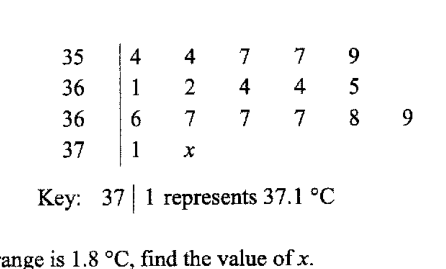
某一天班上 18 名女生的体温显示在下面的茎叶图中。 (茎叶图显示在下方并在 figure_description 中重现。) 键:37 | 1 表示
- (a)
已知极差为 ,求 x 的值。
答案 x = ...
- (b)
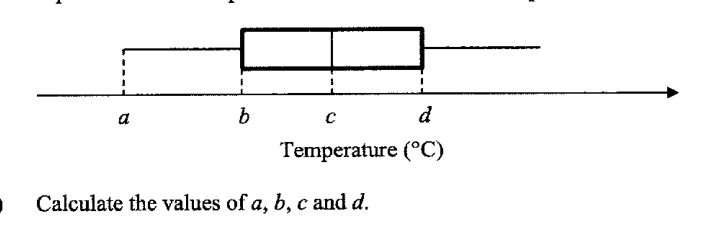
体温也可以用箱线图表示。
- (i)
计算 a, b, c 和 d 的值。
答案 a = ...
b = ...
c = ...
d = ...
- (ii)
求四分位距。
答案 ...
- (i)
- (c)
- (i)
计算平均温度。
答案 ...
- (ii)
求体温的标准差。
答案 ...
- (i)
- (d)
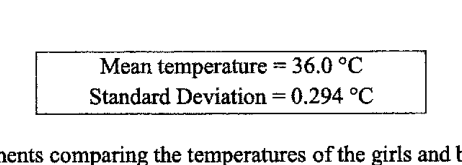
同一天该班 18 名男生的体温信息如下所示。
写出两条评论来比较女生和男生的体温。
1 ...
...
2 ...
...
它不会直接告诉你答案,而是问你卡在哪一步看看 AI 是怎么陪你一步步弄懂这道题的
完整解法
9(a)
1. Use the given range to form and solve an equation for the unknown greatest temperature.
Smallest temperature .
Greatest temperature .
Since the range is ,
Hence .
9(b)(i)
1. List all 18 temperatures in ascending order using $x=2$.
Since , the unknown temperature is .
The ordered data are
2. Find $a$, the minimum temperature.
The minimum value is the first value in the ordered list.
3. Find $c$, the median of 18 values.
There are values, so the median is the average of the 9th and 10th values.
The 9th value is and the 10th value is .
4. Find $b$ and $d$, the lower and upper quartiles.
For values, split the data into the lower 9 values and the upper 9 values.
Lower half:
The middle value of the lower half is the 5th value, so
Upper half:
The middle value of the upper half is the 5th value, so
9(b)(ii)
1. Calculate the interquartile range using the quartiles found earlier.
9(c)(i)
1. Calculate the mean of the 18 temperatures.
Using , the total of the 18 temperatures is
9(c)(ii)
1. Calculate the standard deviation of the 18 temperatures using the mean $36.4^\circ\text{C}$.
Using and the 18 temperatures,
9(d)(1)
1. Compare the mean temperatures and state the contextual conclusion.
Girls' mean temperature .
Boys' mean temperature .
Since , the girls have a higher average temperature than the boys.
The girls have a higher mean temperature than the boys, since .
9(d)(2)
1. Compare the standard deviations of the girls and boys.
Girls' standard deviation
Boys' standard deviation
Since , the girls have the larger standard deviation.
2. State the contextual conclusion about the spread of temperatures.
A larger standard deviation means the temperatures are more spread out from the mean.
Therefore, the girls' temperatures are more spread out / less consistent than the boys' temperatures.
The girls' temperatures are more spread out / less consistent than the boys' temperatures, since their standard deviation is larger: .
AI 分析,可能出错
用 AI 批改,圈出写错的那一步,并自动将你的薄弱点存入错题本,形成你的错因库。
同一知识点的其他题
- 1对 A、B 两家工厂生产的两批各 400 根钢条的质量进行了测量和记录。下方的累积频数图像显示了这些质量。 对于工厂 A 生产的钢条,求 中位数。 答案 ... kg 四分位距。 答案 ... kg 工厂 B 生产的钢条比工厂 A 生产的钢…
- 2茎叶图显示了某班男生和女生的测试成绩。 [茎叶图印刷为两列,左列标为“男生”(Boys),右列标为“女生”(Girls),共用中间的一列茎。键(男生)8 | 3 表示 38。键(女生)4 | 1 表示 41。] 艾尔文在下方的箱线图中表示了…
- 3在一组由五个数字组成的集合中,最小的数字是一个偶数,且它是质数。极差和平均数都是 7。中位数也是唯一的众数。写出这五个数字。
- 4下面的茎叶图显示了学生在一次数学测试中的成绩。 中位数成绩, 答案 ___ 四分位距。 答案 ___
- 5记录了一组 19 名学生在一次测试中的成绩,成绩如茎叶图所示。众数是 42 分。 求 a 和 b 的值。 答案 a = ... b = ... 求中位数成绩。 计算成绩的平均数和标准差。 答案 平均数 = ... 标准差 = ... 另一组…