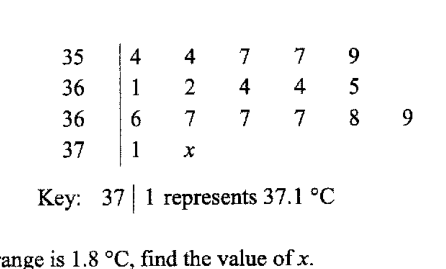
The temperatures of eighteen girls in a class on a particular day are shown in the stem-and-leaf diagram. (Stem-and-leaf diagram shown below and reproduced in figure_description.) Key: 37 | 1 represents
- (a)
Given that the range is , find the value of x.
Answer x = ...
- (b)
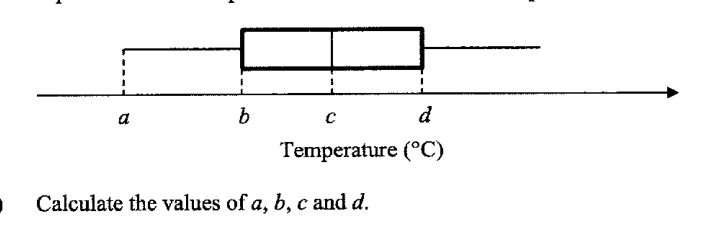
The temperatures can be represented on a box-and-whisker plot.
- (i)
Calculate the values of a, b, c and d.
Answer a = ...
b = ...
c = ...
d = ...
- (ii)
Find the interquartile range.
Answer ...
- (i)
- (c)
- (i)
Calculate the mean temperature.
Answer ...
- (ii)
Find the standard deviation of the temperatures.
Answer ...
- (i)
- (d)
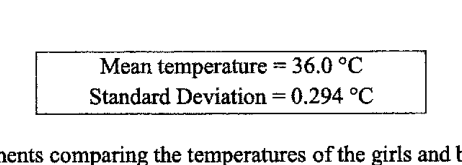
Information on the temperatures of eighteen boys in a class on that same particular day is shown below.
Make two comments comparing the temperatures of the girls and boys.
1 ...
...
2 ...
...
It won't just hand you the answer — it asks where you're stuck.How the checker works
Worked solution
9(a)
1. Use the given range to form and solve an equation for the unknown greatest temperature.
Smallest temperature .
Greatest temperature .
Since the range is ,
Hence .
9(b)(i)
1. List all 18 temperatures in ascending order using $x=2$.
Since , the unknown temperature is .
The ordered data are
2. Find $a$, the minimum temperature.
The minimum value is the first value in the ordered list.
3. Find $c$, the median of 18 values.
There are values, so the median is the average of the 9th and 10th values.
The 9th value is and the 10th value is .
4. Find $b$ and $d$, the lower and upper quartiles.
For values, split the data into the lower 9 values and the upper 9 values.
Lower half:
The middle value of the lower half is the 5th value, so
Upper half:
The middle value of the upper half is the 5th value, so
9(b)(ii)
1. Calculate the interquartile range using the quartiles found earlier.
9(c)(i)
1. Calculate the mean of the 18 temperatures.
Using , the total of the 18 temperatures is
9(c)(ii)
1. Calculate the standard deviation of the 18 temperatures using the mean $36.4^\circ\text{C}$.
Using and the 18 temperatures,
9(d)(1)
1. Compare the mean temperatures and state the contextual conclusion.
Girls' mean temperature .
Boys' mean temperature .
Since , the girls have a higher average temperature than the boys.
The girls have a higher mean temperature than the boys, since .
9(d)(2)
1. Compare the standard deviations of the girls and boys.
Girls' standard deviation
Boys' standard deviation
Since , the girls have the larger standard deviation.
2. State the contextual conclusion about the spread of temperatures.
A larger standard deviation means the temperatures are more spread out from the mean.
Therefore, the girls' temperatures are more spread out / less consistent than the boys' temperatures.
The girls' temperatures are more spread out / less consistent than the boys' temperatures, since their standard deviation is larger: .
AI analysis — may contain mistakes.
Worked this one out on paper? Snap your steps and Gigle's AI math checker will circle the step where it went wrong.
More questions on this topic
- 1The masses of two batches of 400 steel bars produced by factory A and B were measured and recorded. The cumulative frequ…
- 2The stem-and-leaf diagram shows the test scores of the boys and girls from a particular class. [Stem-and-leaf diagram pr…
- 3The smallest of a set of five number is an even number and it is prime. The range and the mean is 7. The median is also…
- 4The following stem-and-leaf diagram shows the scores of students in a math test. the median score, Answer ___ the interq…
- 5The marks of a group of 19 students in a test were recorded, as the marks are shown in the stem and leaf diagram. The mo…