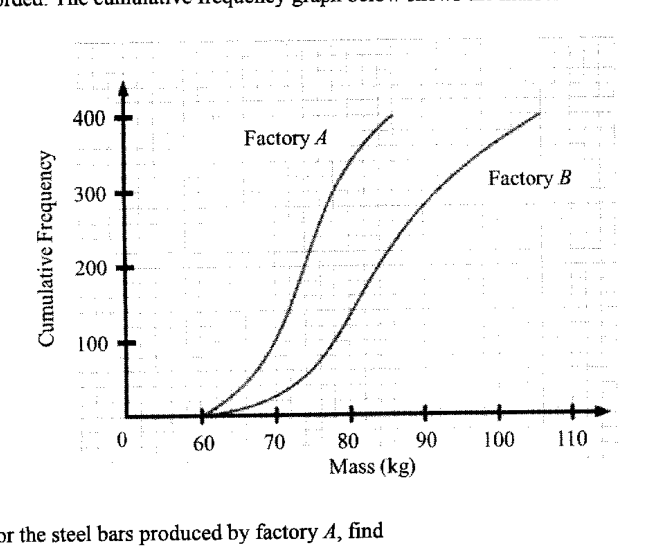
The masses of two batches of 400 steel bars produced by factory A and B were measured and recorded. The cumulative frequency graph below shows the masses.
- (a)
For the steel bars produced by factory A, find
- (i)
the median.
Answer ... kg
- (ii)
the interquartile range.
Answer ... kg
- (i)
- (b)
The steel bars produced by factory B are heavier than those produced by factory A.
Do you agree? Explain your answer. - (c)
Which factory is more consistent in the production of steel bars? Support your answer with workings.
Answer :
...
- (d)
One steel bar is chosen at random from factory A and another steel bar is chosen at random from factory B.
Find, as a fraction in its simplest form, the probability that both steel bars chosen are more than 80kg.
Answer ...
It won't just hand you the answer — it asks where you're stuck.How the checker works
Worked solution
5(b)
1. Compare the two cumulative frequency curves and justify the conclusion
For any given cumulative frequency, the point on Factory B's curve corresponds to a larger mass than the point on Factory A's curve, since Factory B's curve lies to the right of Factory A's curve.
Therefore, the steel bars produced by Factory B are generally heavier than those produced by Factory A.
Yes. I agree. The cumulative frequency curve for Factory B is to the right of Factory A, so for the same cumulative frequency, the mass for Factory B is greater. Hence the steel bars from Factory B are generally heavier.
AI analysis — may contain mistakes.
Worked this one out on paper? Snap your steps and Gigle's AI math checker will circle the step where it went wrong.
More questions on this topic
- 1The diagram below shows the speed-time graph of a bus journey. The bus accelerated from rest at 1.25 m/s^2 to a speed of…
- 2The stem-and-leaf diagram shows the test scores of the boys and girls from a particular class. [Stem-and-leaf diagram pr…
- 3Explain how the line graph above may be misleading. Answer ...
- 4The graph shows the sales at a particular mall. Explain why the mean sales is not a good indication as a central measure…
- 5Sam is a 40-year-old man who earns a gross salary of $8000 a month. He is a Singaporean and an employee of a Singapore…