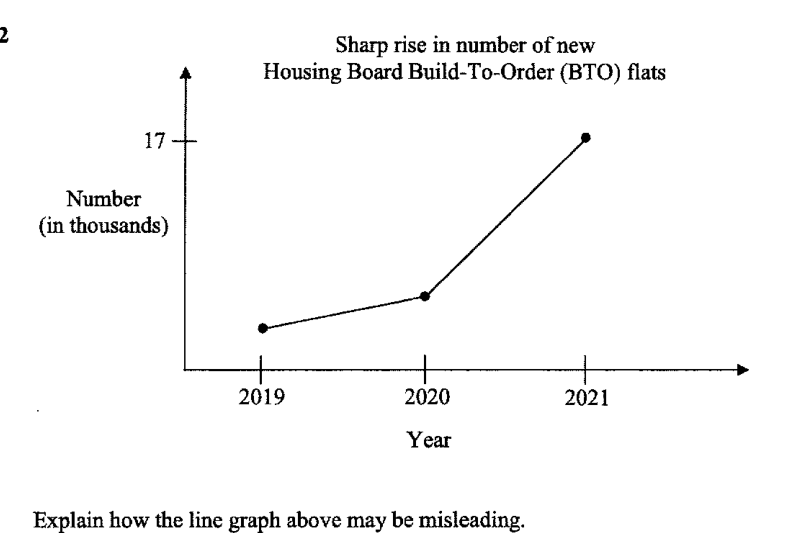
Explain how the line graph above may be misleading. Answer ...
It won't just hand you the answer — it asks where you're stuck.How the checker works
Worked solution
2
1. Explain the misleading feature of the line graph
The vertical axis shows only a tick at and does not clearly start from or show a consistent scale. This exaggerates the steepness of the line, making the increase in the number of BTO flats look like a sharp rise.
Answer
The vertical axis does not start at and has an unclear/broken scale, so the increase appears much sharper than it actually is.
AI analysis — may contain mistakes.
Worked this one out on paper? Snap your steps and Gigle's AI math checker will circle the step where it went wrong.
More questions on this topic
- 1Below is a graph from the Annual Climate Singapore 2023, which shows the top 10 warmest years in Singapore since 1929. S…
- 2A website shows a poster of the poaching statistics of African elephants. Explain how the poster above may be misleading…
- 3The graph shows the number of cyclists in an annual cycling marathon for the years 2017 to 2019. State one aspect of the…
- 4A company presented their 2023 financial report in this graph. State one aspect of the graph that may be misleading and…
- 5Based on the pie chart shown on the right, Mrs Goh told Mr Goh that male drivers are worse drivers than female drivers.…