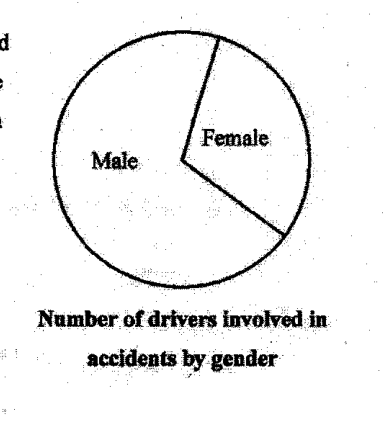
Based on the pie chart shown on the right, Mrs Goh told Mr Goh that male drivers are worse drivers than female drivers. Explain why Mrs Goh should not make such a statement. What could be a better mathematical measure to make a conclusion whether the male or female drivers are worse drivers?
It won't just hand you the answer — it asks where you're stuck.How the checker works
Worked solution
13
1. Identify why the conclusion from the pie chart is not valid
The pie chart compares only the numbers of male and female drivers involved in accidents. It does not take into account the total number of male and female drivers. If there are more male drivers overall, a larger male sector does not necessarily mean male drivers are worse drivers.
2. State a better mathematical measure for comparison
Use accident rates or percentages within each gender:
Mrs Goh should not make the statement because the pie chart only shows the number of drivers involved in accidents by gender. It does not show the total number of male and female drivers, so there may simply be more male drivers. A better measure would be to compare the accident rate, for example
AI analysis — may contain mistakes.
Worked this one out on paper? Snap your steps and Gigle's AI math checker will circle the step where it went wrong.
More questions on this topic
- 1Explain how the line graph above may be misleading. Answer ...
- 2Below is a graph from the Annual Climate Singapore 2023, which shows the top 10 warmest years in Singapore since 1929. S…
- 3A website shows a poster of the poaching statistics of African elephants. Explain how the poster above may be misleading…
- 4The graph shows the number of cyclists in an annual cycling marathon for the years 2017 to 2019. State one aspect of the…
- 5A company presented their 2023 financial report in this graph. State one aspect of the graph that may be misleading and…