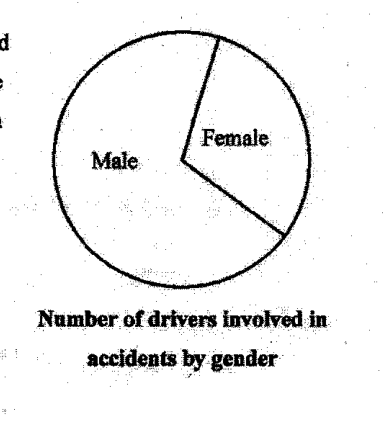
根据右侧所示的饼图,吴太太对吴先生说,男司机的驾驶技术比女司机差。请解释为什么吴太太不应该做出这样的陈述。要得出男司机还是女司机驾驶技术更差的结论,什么才是更好的数学衡量指标?
它不会直接告诉你答案,而是问你卡在哪一步看看 AI 是怎么陪你一步步弄懂这道题的
完整解法
13
1. Identify why the conclusion from the pie chart is not valid
The pie chart compares only the numbers of male and female drivers involved in accidents. It does not take into account the total number of male and female drivers. If there are more male drivers overall, a larger male sector does not necessarily mean male drivers are worse drivers.
2. State a better mathematical measure for comparison
Use accident rates or percentages within each gender:
Mrs Goh should not make the statement because the pie chart only shows the number of drivers involved in accidents by gender. It does not show the total number of male and female drivers, so there may simply be more male drivers. A better measure would be to compare the accident rate, for example
AI 分析,可能出错
用 AI 批改,圈出写错的那一步,并自动将你的薄弱点存入错题本,形成你的错因库。
同一知识点的其他题
- 1解释上面的折线图可能如何产生误导。 答案 ...
- 2下面是来自《2023年新加坡年度气候报告》的一张图表,显示了自1929年以来新加坡最热的10个年份。 指出该图表中可能具有误导性的一个方面,并解释这如何可能导致对图表的误读。 ...
- 3某网站展示了一幅关于非洲象偷猎统计数据的海报。 解释上述海报可能具有误导性的原因。
- 4该图表显示了 2017 年至 2019 年年度自行车马拉松赛中的骑行人数。 指出该图表中可能具有误导性的一个方面。 解释这可能会如何导致对图表的误解。
- 5一家公司在这张图表中展示了他们 2023 年的财务报告。 指出图表中可能产生误导的一个方面,并解释这可能会如何导致误解。 答案 ...