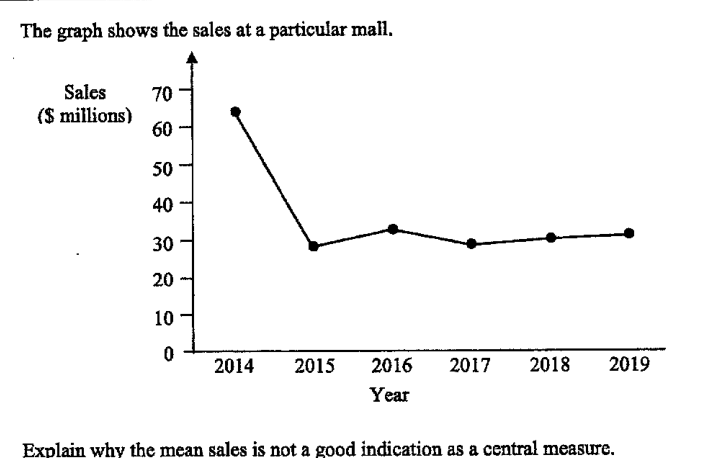
The graph shows the sales at a particular mall.
- ( )
Explain why the mean sales is not a good indication as a central measure.
It won't just hand you the answer — it asks where you're stuck.How the checker works
Worked solution
2[0]
1. Explain why the mean is not representative
The sales in 2014 is much higher than the sales in the other years. This outlier will increase the mean, so the mean will not represent the typical sales at the mall well.
Answer
The 2014 sales value is much higher than the other years, so it is an outlier. It would pull the mean upwards, making the mean not representative of the typical sales.
AI analysis — may contain mistakes.
Worked this one out on paper? Snap your steps and Gigle's AI math checker will circle the step where it went wrong.
More questions on this topic
- 1六(1)班名男生分钟做仰卧起坐成绩如下:单位:次…
- 2The stem and leaf diagram below shows the marks obtained by 30 students in a Science test marked out of 80 marks. Find t…
- 3Mr Tan designed two computer models X and Y. Both have the same manufacturing cost. Mr Tan engaged his existing client M…
- 4A class of 10 boys and 10 girls took a test. The girls' marks were 4, 5, 6, 7, 7, 7, 8, 8, 8 and 10. State the modal mar…
- 5The following diagram represents the stem-and-leaf scores of sixteen students who took a Mathematics test. If the median…