Mr Tan designed two computer models X and Y. Both have the same manufacturing cost.
Mr Tan engaged his existing client Mr Chew to find out which model is more likely to sell. Mr Chew sent a survey to 1000 random customers, with the photos, price and specifications for each model.
Question 1 I will buy Model X. SD D N A SA
Question 2 I will buy Model Y. SD D N A SA
SD = Strongly Disagree, D = Disagree, N = Neutral, A = Agree and SA = Strongly Agree.
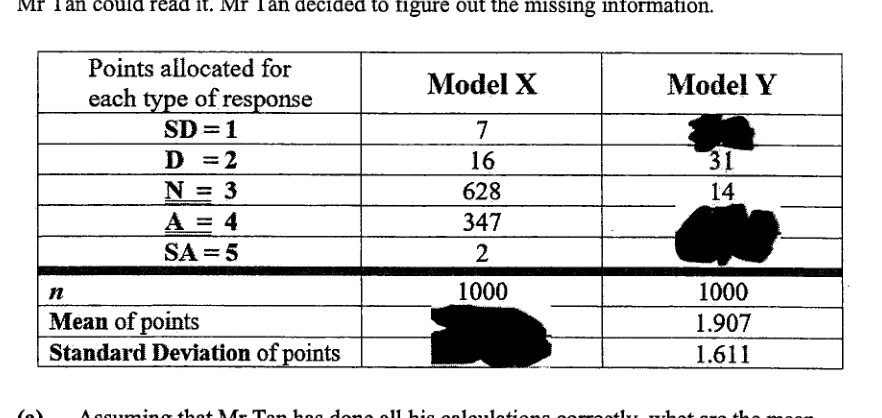
Mr Chew prepared the following report. Unfortunately, coffee spilled on the report before Mr Tan could read it. Mr Tan decided to figure out the missing information.
- (a)
Assuming that Mr Tan has done all his calculations correctly, what are the mean and the standard deviation for Model X? Give your answers to 3 decimal places.
Answer mean = ...
standard deviation = ... - (b)
By comparing the means for both models, which model should Mr Chew recommend Mr Tan to produce? State your reason clearly.
Answer
- (c)
Mr Tan became troubled with the high standard deviation for Model Y, so he decided to find the missing values for SD, A and SA for Model Y. Help Mr Tan calculate the missing information.
Answer missing values for SD = ..., A = ..., SA = ...
- (d)
With all the information available now, which model should Mr Tan produce? State your reason clearly.
Answer
It won't just hand you the answer — it asks where you're stuck.How the checker works
Worked solution
10(a)
1. Calculate the mean score for Model X using the frequency table.
For Model X,
2. Calculate the standard deviation using $\sqrt{\frac{\sum fx^2}{n}-\bar{x}^2}$.
First find :
So,
To 3 decimal places,
mean
standard deviation
10(b)
1. Compare the two mean scores and interpret the higher mean in context.
For Model X, mean .
For Model Y, mean .
Since , Model X has the higher average response score. A higher score means stronger agreement with buying the model, so Model X is more likely to sell.
Mr Chew should recommend Model X, because its mean score, , is higher than Model Y's mean score, . This means customers were more likely to agree that they would buy Model X.
10(c)
1. Define variables for the missing frequencies and use the total number of customers.
Let the missing frequencies for Model Y be
, , .
Since there are customers,
2. Use the given mean to form a second equation.
The mean for Model Y is , so the total score is
Using the points ,
3. Eliminate one variable using the total-frequency and mean equations.
Subtract (1) from (2):
4. Use the standard deviation formula to determine the value of $z$.
For a frequency distribution,
For Model Y,
Using ,
From (3), , so
Hence
Since the standard deviation is to 3 decimal places,
Testing the integer value that satisfies this gives
Check:
So .
5. Find the remaining missing frequencies.
Substitute into (3):
Substitute and into (1):
Therefore,
SD , A , SA
10(d)
1. Compare the completed response distributions for the strongest buying intention.
From the completed table:
Model X has customers who chose SA.
Model Y has customers who chose SA.
2. Make a recommendation with a clear contextual reason.
Since SA means “Strongly Agree”, the customers who chose SA show the strongest intention to buy.
Model Y has far more SA responses, so it is more likely to have strong demand despite its lower mean.
Mr Tan should produce Model Y, because it has many more customers who strongly agree that they will buy it: customers for Model Y compared with only customers for Model X.
AI analysis — may contain mistakes.
Worked this one out on paper? Snap your steps and Gigle's AI math checker will circle the step where it went wrong.
More questions on this topic
- 1A survey was carried out to find out the number of emails received in a week by each of a group of students. The table b…
- 2The cumulative frequency curve shows the marks obtained by the 120 students in a recent Mathematics Test. The maximum ma…
- 3The marks of a group of 19 students in a test were recorded, as the marks are shown in the stem and leaf diagram. The mo…
- 4The following stem-and-leaf diagram shows the marks obtained by 20 pupils in a class test that has a total mark of 50. S…
- 5The masses of 20 bags, in kg, are measured. The results are shown on the stem-and-leaf diagram. Find the mean mass of th…