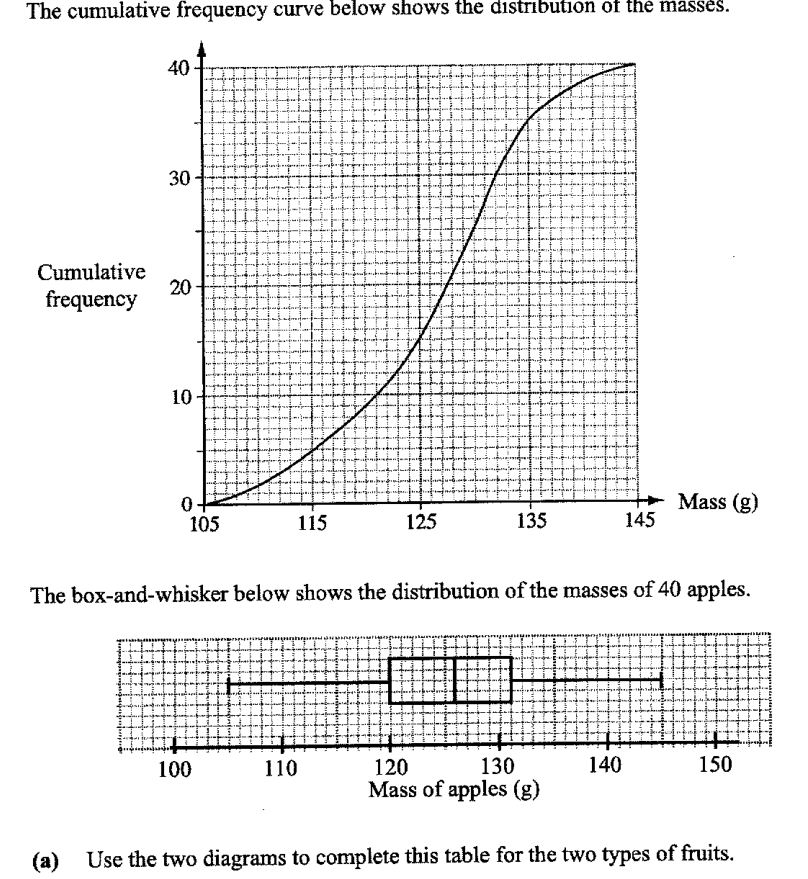
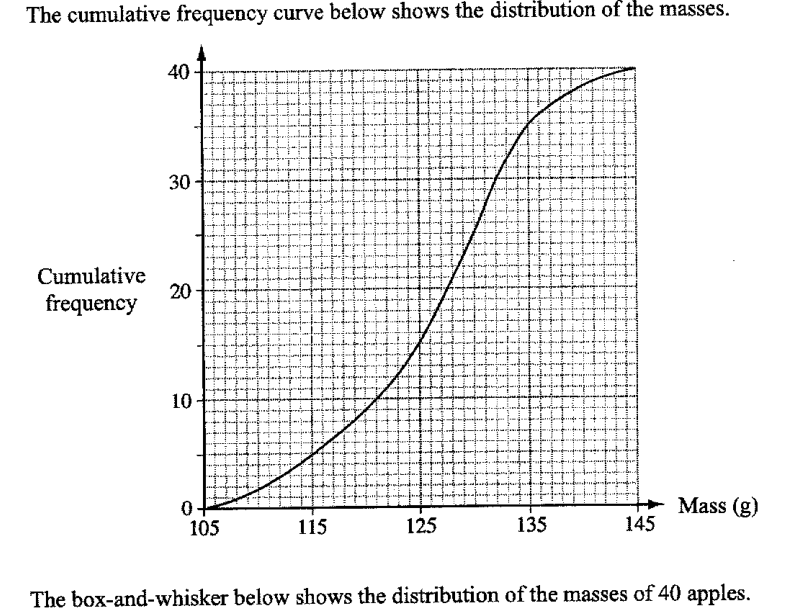
The masses of 40 oranges were measured. The cumulative frequency curve below shows the distribution of the masses.
- ((a))
Use the two diagrams to complete this table for the two types of fruits.
-
Type Lower quartile Median Upper quartile Inter-quartile range Orange g g g 11 g Apple g 126 g g 11 g
-
- ((b))
Describe how the cumulative frequency curve for the apples may differ from the curve for the oranges.
- ((c))
Below are two statements comparing the distributions of the masses of oranges and apples.
For each statement, write True or False. Give a reason for each answer, stating clearly which statistics you use to make your decision.
- ((i))
The apples are heavier than the oranges.
... because ...
... because ...
- ((ii))
A greater percentage of oranges weigh more than 131g than apples.
... because ...
... because ...
- ((i))
- ((d))
The grouped frequency table for the masses of the oranges is given below.
- ((i))
Calculate an estimate of the mean mass.
Answer ... g
- ((ii))
Calculate an estimate of the standard deviation.
Answer ... g
- ((iii))
2 oranges are chosen at random without replacement.
Calculate the probability that at least one of the oranges weigh at least 125 g.Answer ...
- ((i))
It won't just hand you the answer — it asks where you're stuck.How the checker works
Worked solution
10((d))((i))
1. Find the class midpoints and compute the estimated total mass.
Class midpoints:
2. Divide by the total frequency to estimate the mean.
Total frequency
g
10((d))((ii))
1. Use class midpoints and the estimated mean to calculate the estimated standard deviation.
Class midpoints: .
Using the estimated mean from part (d)(i), ,
g
10((d))((iii))
1. Find the number of oranges weighing at least 125 g and less than 125 g.
From the table,
Number weighing at least g .
Number weighing less than g .
2. Use the complement of 'at least one' and calculate the probability without replacement.
AI analysis — may contain mistakes.
Worked this one out on paper? Snap your steps and Gigle's AI math checker will circle the step where it went wrong.
More questions on this topic
- 1The masses of two batches of 400 steel bars produced by factory A and B were measured and recorded. The cumulative frequ…
- 2The stem-and-leaf diagram shows the test scores of the boys and girls from a particular class. [Stem-and-leaf diagram pr…
- 3The cumulative frequency graph shows distribution of the waiting times before being served, in minutes, of 60 customers…
- 4The waiting time, t in minutes, for 40 customers at two phone service shops, Shop A and Shop B, are as follows. Calculat…
- 5The temperatures of eighteen girls in a class on a particular day are shown in the stem-and-leaf diagram. (Stem-and-leaf…