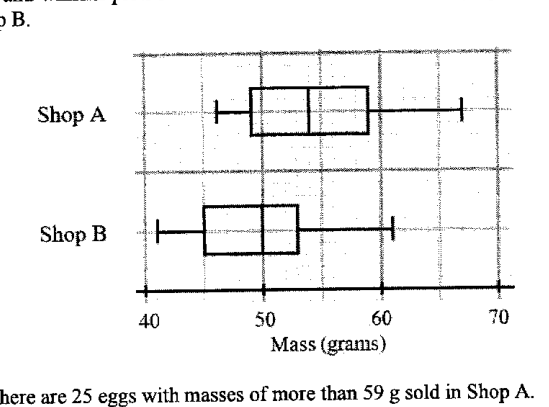
箱线图显示了商店 A 和商店 B 售出的鸡蛋质量(克)的分布情况。
- (i)
商店 A 售出的鸡蛋中,有 25 个鸡蛋的质量超过 59 克。
求商店 A 售出的鸡蛋总数。
答 ... 个鸡蛋
- (ii)
对 A 商店和 B 商店出售的鸡蛋质量的平均值进行比较并发表评述,再对其质量的分布进行比较并发表评述。
请用数据来支持你的回答。
- ...
...
- ...
...
- (8)
- (b)
在 80 个鸡蛋的样本中,有 4 个是有裂缝的。
- (i)
从样本中随机抽取一个鸡蛋。
求该鸡蛋有裂纹的概率。
答案 ...
- (ii)
从样本中随机抽取两个鸡蛋。
求两个鸡蛋都有裂纹的概率。
答案 ...
- (iii)
从样本中随机抽取三个鸡蛋。
求至少有一个鸡蛋破裂的概率。
答案 ...
- (i)
- (b)
它不会直接告诉你答案,而是问你卡在哪一步看看 AI 是怎么陪你一步步弄懂这道题的
完整解法
8 (a)(i)
1. Relate masses above the upper quartile to one quarter of the total number of eggs.
For Shop A, g.
So the eggs with masses more than g make up of the total.
eggs
8 (a)(ii)
1. Compare the averages using the medians from the box-and-whisker plots.
For a box-and-whisker plot, the average is usually compared using the median.
Shop A median g.
Shop B median g.
Since , Shop A has the higher average mass.
2. Compare the distributions using a measure of spread from the box-and-whisker plots.
Use the interquartile range to compare spread.
Shop A:
g.
Shop B:
g.
Since , Shop B has a slightly greater spread in the middle of the masses.
-
The average mass of eggs in Shop A is higher than in Shop B, since the median for Shop A is g while the median for Shop B is g.
-
The masses of eggs in Shop B are more spread out in the middle of the data, since its interquartile range is g, while Shop A's interquartile range is g.
8 (a)(8)(b)(i)
1. Find the probability that the selected egg is cracked.
There are cracked eggs out of eggs.
8 (a)(8)(b)(ii)
1. Find the probability that the first egg selected is cracked.
There are cracked eggs out of eggs.
2. Account for no replacement and multiply the probabilities.
After selecting one cracked egg, there are cracked eggs left out of eggs.
8 (a)(8)(b)(iii)
1. Find the probability that none of the three selected eggs is cracked.
There are uncracked eggs.
2. Use the complement to find the probability that at least one egg is cracked.
AI 分析,可能出错
用 AI 批改,圈出写错的那一步,并自动将你的薄弱点存入错题本,形成你的错因库。
同一知识点的其他题
- 1对 A、B 两家工厂生产的两批各 400 根钢条的质量进行了测量和记录。下方的累积频数图像显示了这些质量。 对于工厂 A 生产的钢条,求 中位数。 答案 ... kg 四分位距。 答案 ... kg 工厂 B 生产的钢条比工厂 A 生产的钢…
- 2茎叶图显示了某班男生和女生的测试成绩。 [茎叶图印刷为两列,左列标为“男生”(Boys),右列标为“女生”(Girls),共用中间的一列茎。键(男生)8 | 3 表示 38。键(女生)4 | 1 表示 41。] 艾尔文在下方的箱线图中表示了…
- 3该累积频数图展示了某一天在餐厅 A 消费的 60 名顾客在接受服务前的等待时间(以分钟为单位)的分布。 利用该曲线估计: 中位数等待时间, 答:... min 四分位距, 答:... min 等待时间的第 35 百分位数。 答:... mi…
- 4两家电话服务店(A 店和 B 店)各 40 名顾客的等待时间 t(单位:分钟)如下。 计算 A 店的平均等待时间。 答:___ 分钟 解释为什么你对 (a)(i) 的回答只是一个估计值。 答 ... 计算 A 店的标准差。 答:___ 分钟…
- 5某一天班上 18 名女生的体温显示在下面的茎叶图中。 (茎叶图显示在下方并在 figure_description 中重现。) 键:37 | 1 表示 已知极差为 …