袋子中放有五个标有数字 1、3、4、6 和 7 的圆盘。从袋子中随机无放回地取出两个圆盘。
- ((a))
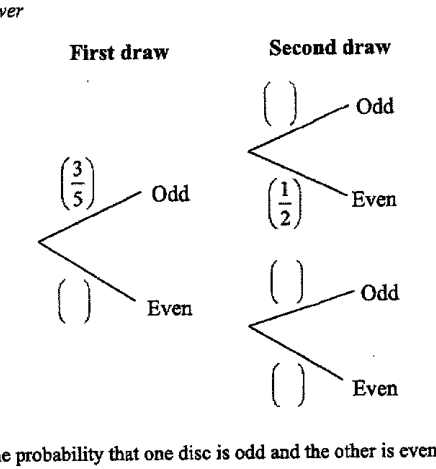
补全树状图以显示可能结果的概率。
- ((b))
求其中一个圆片上的数字是奇数,而另一个是偶数的概率。
答案 ...
- ((c))
彼得认为,抽出的两个数字都小于 4 的概率超过 10%。
他是对的还是错的?解释你的理由。
答案 ...
...
- ((d))
计算所抽取的两个数字之和为质数的概率。
答案 ...
它不会直接告诉你答案,而是问你卡在哪一步看看 AI 是怎么陪你一步步弄懂这道题的
完整解法
3((a))
1. Find the probabilities for the first draw
There are odd discs: , and even discs: .
Total number of discs .
So
2. Find the conditional probabilities for the second draw without replacement
If the first disc is odd, there are discs left: odd and even.
So
If the first disc is even, there are discs left: odd and even.
So
First draw: , .
If first draw is Odd: , .
If first draw is Even: , .
3((b))
1. Add the probabilities of the two favourable outcomes
One disc is odd and the other is even means either:
or .
3((c))
1. Find and compare the probability that both numbers drawn are less than 4
The numbers less than are and .
So it is exactly , not more than . Peter is wrong.
Peter is correct, since , so the chance is not more than .
[Note: If interpreting “more than 10%” strictly, Peter is wrong because it is exactly , not more than .]
3((d))
1. List all possible pairs and identify those with a prime sum
There are possible pairs.
The pairs with a prime sum are
Their sums are respectively .
Since is not prime, the favourable pairs are
So there are favourable ordered outcomes, or equivalently favourable unordered pairs.
2. Calculate the probability of a prime sum
Using ordered outcomes, there are possible outcomes.
The favourable unordered pairs give favourable ordered outcomes.
AI 分析,可能出错
用 AI 批改,圈出写错的那一步,并自动将你的薄弱点存入错题本,形成你的错因库。
同一知识点的其他题
- 1对 A、B 两家工厂生产的两批各 400 根钢条的质量进行了测量和记录。下方的累积频数图像显示了这些质量。 对于工厂 A 生产的钢条,求 中位数。 答案 ... kg 四分位距。 答案 ... kg 工厂 B 生产的钢条比工厂 A 生产的钢…
- 2一个袋子里装有 4 枚黑色硬币、7 枚红色硬币和 11 枚白色硬币。从袋子里随机连续抽取两枚硬币(不放回)。 求第二次抽到白色硬币的概率。 答案 ... 向袋子中加入 枚黄色硬币。两次抽取都抽到黑色硬币的概率为 …
- 3一个袋子里有 12 个球。 其中 2 个是红球,n 个是绿球,其余是蓝球。 尤妮丝随机从袋中取出两个球,且不放回。 补全树状图。 尤妮丝取出两个蓝球的概率是 。 写出一个代表这一信息的方程,并证明它可以化简为:…
- 4进行了一项调查,以统计一组学生中每人一周内收到的电子邮件数量。 下表表示调查的结果。 | 电子邮件数量 (n) | 频数 | |---|---| | | 8 | | | 13 |…
- 5累积频数曲线显示了 120 名学生在最近一次数学测试中获得的分数。满分是 100 分。 完成所得分数的分组频数表。 | 学生所得分数, x | 频数 | |---|---| | 0 ≤ x < 20 | 10 | | 20 ≤ x < 40…