进行了一项调查,以统计 100 名顾客在超市里的消费金额。 这些信息的分组如下。
- ((i))
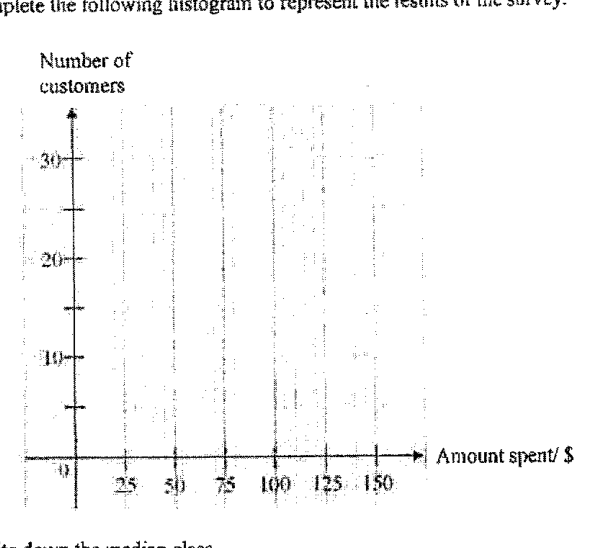
完成以下直方图以表示调查结果。
- ((ii))
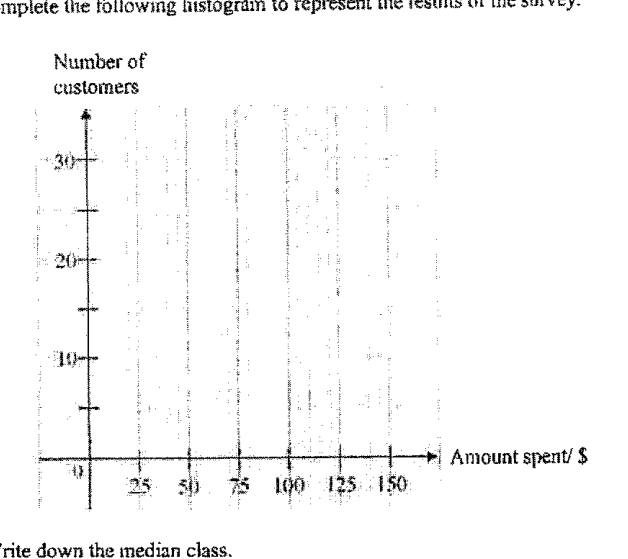
写出中位数所在组。
答
- ((iii))
写出众数所在组。
答
- ((iv))
写出使用直方图展示调查结果的一个优点。
答
- (6)
- (b)
简的袋子里有十枚硬币。
有四枚 20¢ 硬币、三枚 50¢ 硬币和三枚 $1 硬币。她从袋子里不放回地取出了两枚硬币。
- (i)
画出树状图以展示所有可能结果的概率。
- (ii)
求出两枚硬币面额不同的概率(用最简分数表示)。
- (iii)
求出两枚硬币的总面值超过 1 美元的概率(用最简分数表示)。
- (i)
- (b)
它不会直接告诉你答案,而是问你卡在哪一步看看 AI 是怎么陪你一步步弄懂这道题的
完整解法
6(a)((i))
1. Identify the class intervals and their frequencies from the table.
The class intervals are all of width :
Their frequencies are respectively
2. Draw the histogram bars with correct widths and heights.
Since each class interval has the same width, use the number of customers as the bar height.
Draw adjacent bars over:
Draw six adjacent bars with intervals and heights:
| Amount spent / $ | Bar height |
|---|---|
The bars should be joined with no gaps.
6(a)((ii))
1. Find which class contains the median customer amount.
There are customers, so the median lies between the th and st values.
Cumulative frequencies:
Since the th and st values lie in the class where the cumulative frequency reaches , the median class is
.
6(a)((iii))
1. Find the class interval with the highest number of customers.
The frequencies are .
The greatest frequency is , which corresponds to the class interval .
6(a)((iv))
1. State one advantage of presenting the grouped survey results using a histogram.
A histogram displays grouped continuous data visually, so it is easy to compare how many customers fall in each spending interval.
It gives a clear visual comparison of the frequencies in the different amount-spent intervals.
6(a)(6)(b)(i)
1. Find the probabilities for the first coin drawn.
There are coins in total:
So the first branches are
2. Find the conditional probabilities for the second coin, remembering that the draw is without replacement.
After one coin is taken, there are coins left.
If the first coin is , the remaining coins are of , of and of :
If the first coin is , the remaining coins are of , of and of :
If the first coin is , the remaining coins are of , of and of :
Tree diagram probabilities:
-
First coin:
-
Second coin:
- after : , ,
- after : , ,
- after : , ,
6(a)(6)(b)(ii)
1. Find the probability that the two coins have the same denomination.
2. Use the complement to find the probability of different denominations.
6(a)(6)(b)(iii)
1. Identify the outcomes where the total value is more than \$1.
The total is more than $1 for:
, , , , and .
2. Add the probabilities of the favourable outcomes.
AI 分析,可能出错
用 AI 批改,圈出写错的那一步,并自动将你的薄弱点存入错题本,形成你的错因库。
同一知识点的其他题
- 1对 A、B 两家工厂生产的两批各 400 根钢条的质量进行了测量和记录。下方的累积频数图像显示了这些质量。 对于工厂 A 生产的钢条,求 中位数。 答案 ... kg 四分位距。 答案 ... kg 工厂 B 生产的钢条比工厂 A 生产的钢…
- 2下图显示了一辆公共汽车行驶过程中的速度-时间图像。 公共汽车在 20 秒内从静止以 1.25 m/s^2 的加速度加速到 v m/s 的速度,并保持该速度行驶到第 T 秒,然后在第 80 秒时停止。 全程行驶的总路程为 1450 m。 求下…
- 3茎叶图显示了某班男生和女生的测试成绩。 [茎叶图印刷为两列,左列标为“男生”(Boys),右列标为“女生”(Girls),共用中间的一列茎。键(男生)8 | 3 表示 38。键(女生)4 | 1 表示 41。] 艾尔文在下方的箱线图中表示了…
- 4解释上面的折线图可能如何产生误导。 答案 ...
- 5该图表显示了某商场的销售额。 解释为什么平均销售额不能很好地作为集中趋势的度量。