A survey was carried out to find the amount of money spent by 100 customers in a supermarket. This information was grouped as follows.
- ((i))
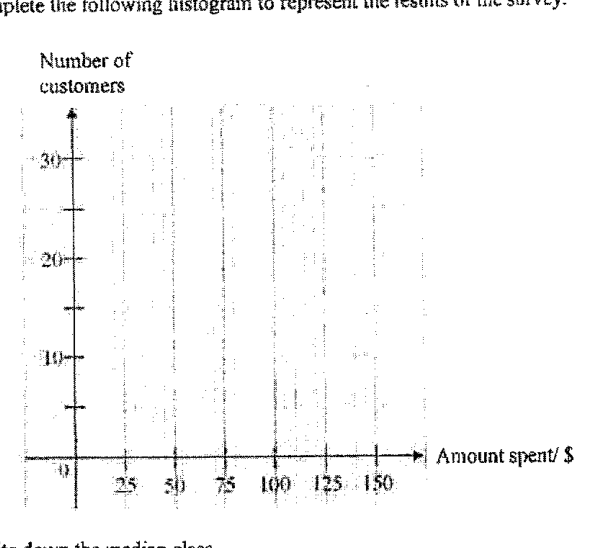
Complete the following histogram to represent the results of the survey.
- ((ii))
Write down the median class.
Answer
- ((iii))
Write down the modal class.
Answer
- ((iv))
Write down an advantage of using a histogram to present the results of the survey.
Answer
- (6)
- (b)
Jane has ten coins in a bag.
There are four 20¢ coins, three 50¢ coins and three $1 coins. She took two coins from the bag without replacement.
- (i)
Draw a tree diagram to show the probabilities of the possible outcomes.
- (ii)
Find, as a fraction in its simplest form, the probability that the two coins have different denominations.
- (iii)
Find, as a fraction in its simplest form, the probability that the total value of the two coins is more than a dollar.
- (i)
- (b)
It won't just hand you the answer — it asks where you're stuck.How the checker works
Worked solution
6(a)((i))
1. Identify the class intervals and their frequencies from the table.
The class intervals are all of width :
Their frequencies are respectively
2. Draw the histogram bars with correct widths and heights.
Since each class interval has the same width, use the number of customers as the bar height.
Draw adjacent bars over:
Draw six adjacent bars with intervals and heights:
| Amount spent / $ | Bar height |
|---|---|
The bars should be joined with no gaps.
6(a)((ii))
1. Find which class contains the median customer amount.
There are customers, so the median lies between the th and st values.
Cumulative frequencies:
Since the th and st values lie in the class where the cumulative frequency reaches , the median class is
.
6(a)((iii))
1. Find the class interval with the highest number of customers.
The frequencies are .
The greatest frequency is , which corresponds to the class interval .
6(a)((iv))
1. State one advantage of presenting the grouped survey results using a histogram.
A histogram displays grouped continuous data visually, so it is easy to compare how many customers fall in each spending interval.
It gives a clear visual comparison of the frequencies in the different amount-spent intervals.
6(a)(6)(b)(i)
1. Find the probabilities for the first coin drawn.
There are coins in total:
So the first branches are
2. Find the conditional probabilities for the second coin, remembering that the draw is without replacement.
After one coin is taken, there are coins left.
If the first coin is , the remaining coins are of , of and of :
If the first coin is , the remaining coins are of , of and of :
If the first coin is , the remaining coins are of , of and of :
Tree diagram probabilities:
-
First coin:
-
Second coin:
- after : , ,
- after : , ,
- after : , ,
6(a)(6)(b)(ii)
1. Find the probability that the two coins have the same denomination.
2. Use the complement to find the probability of different denominations.
6(a)(6)(b)(iii)
1. Identify the outcomes where the total value is more than \$1.
The total is more than $1 for:
, , , , and .
2. Add the probabilities of the favourable outcomes.
AI analysis — may contain mistakes.
Worked this one out on paper? Snap your steps and Gigle's AI math checker will circle the step where it went wrong.
More questions on this topic
- 1The masses of two batches of 400 steel bars produced by factory A and B were measured and recorded. The cumulative frequ…
- 2The diagram below shows the speed-time graph of a bus journey. The bus accelerated from rest at 1.25 m/s^2 to a speed of…
- 3The stem-and-leaf diagram shows the test scores of the boys and girls from a particular class. [Stem-and-leaf diagram pr…
- 4Explain how the line graph above may be misleading. Answer ...
- 5The graph shows the sales at a particular mall. Explain why the mean sales is not a good indication as a central measure…