Let .
- (a)
Complete the table of values for .
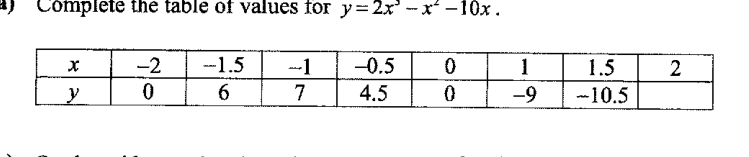
- (b)
On the grid opposite, draw the graph of for .
- (c)
The equation only has one solution.
- (i)
Explain how this can be seen from your graph.
Answer
- (ii)
Use your graph to find the solution of the equation .
Answer ___
- (i)
- (d)
Use your graph to find the x-coordinate of the maximum point.
Answer ___
It won't just hand you the answer — it asks where you're stuck.How the checker works
Worked solution
5(a)
1. Find the missing table value when $x=2$.
For ,
Check carefully:
so
The missing value is .
5(b)
1. Use the completed table to identify all coordinates to be plotted.
From the completed table,
2. Plot the points accurately on the given grid.
Plot each coordinate on the axes, using the given vertical scale marked in units of and the horizontal values from to .
3. Join the plotted points with a smooth curve over the required interval.
Draw a smooth continuous curve through the plotted points for
The curve should pass through the origin and continue down to approximately on the right.
A smooth curve of drawn through the points , , , , , , and for .
5(c)(i)
1. Relate the given equation to the graph already drawn.
The graph drawn is
.
Given
,
write
.
So
.
2. Rewrite the equation as a straight line to compare with the curve.
From
,
we get
.
3. Explain why there is only one solution from the graph.
The solutions of the equation are the -coordinates where the curve
meets the line
.
From the graph, the line meets the curve at only one point, so there is only one solution.
can be written as . On the graph, the line intersects the curve at only one point. Hence the equation has only one solution.
5(c)(ii)
1. Rewrite the equation in a form that can be used with the drawn curve.
The graph drawn is for
.
Given
write
So draw the straight line
on the same graph and read the -coordinate where it meets the curve.
2. Read the solution from the point of intersection.
From the graph, the line intersects the curve at approximately
5(d)
1. Identify the maximum point on the drawn curve and read its $x$-coordinate.
From the graph of , the maximum point is the highest turning point on the curve. Reading its horizontal position from the graph gives
AI analysis — may contain mistakes.
Worked this one out on paper? Snap your steps and Gigle's AI math checker will circle the step where it went wrong.
More questions on this topic
- 1Sketch the graph in the spaces below. Hence, state the number of solutions for the equat…
- 2By completing the square or otherwise, express in terms of given that . Answer x = ___ or ___…
- 3若二次函数的图象开口向下,且经过点.符合条件的一个二次函数的解析式为 ___ .
- 4Sketch the graph of on the axes below, indicating clearly the coordinates of the intercepts and the…
- 5函数y=kx+b交x轴于(2,0),若其图象过二、四象限,则此函数关系式可以是 .