下表显示了 X 厂制造 of 50 辆汽车每升汽油行驶的距离。
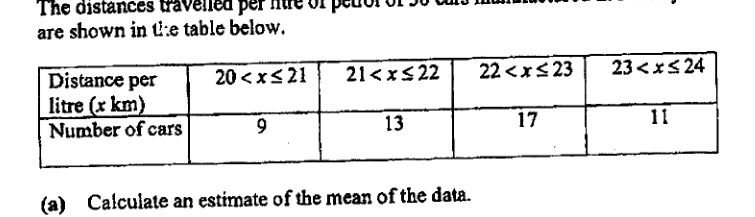
- ((a))
计算该数据平均值的估计值。
答:... km
- ((b))
计算该数据标准差的估计值。
答:... km
- ((c))
对 Y 厂制造的 45 辆同类汽车每升汽油行驶的距离进行同样方式的列表。
该数据的估计平均值和标准差分别为 22.5 km 和 0.985 km。- ((i))
对 X 厂和 Y 厂制造的汽车的行驶距离进行两项比较。
答
(1) ...
...
(2) ...
...
- ((ii))
Y 厂制造的另一批 5 辆汽车每升汽油的行驶距离在 22 km 至 23 km 之间。
如果将这些信息纳入计算平均值和标准差的数据中,请说明对其产生的影响:- ((a))
平均值。
答:...
- ((b))
标准差。
答:...
- ((a))
- ((i))
它不会直接告诉你答案,而是问你卡在哪一步看看 AI 是怎么陪你一步步弄懂这道题的
完整解法
4((a))
1. Find the class midpoints and calculate the estimated mean using the grouped-data mean formula.
Class midpoints:
km
4((b))
1. Use the grouped-data standard deviation formula with the class midpoints.
Class midpoints:
From part (a), estimated mean .
km
4((c))((i))
1. Compare the estimated means of Factory X and Factory Y.
For Factory X, estimated mean km.
For Factory Y, estimated mean km.
Since , cars manufactured by Factory Y travel a greater distance per litre on average.
2. Compare the standard deviations of Factory X and Factory Y.
For Factory X, standard deviation km.
For Factory Y, standard deviation km.
Since , the distances for Factory Y are less spread out, so Factory Y cars are more consistent in distance travelled per litre.
(1) Factory Y cars travel a greater distance per litre on average, since the mean for Y is km while the mean for X is km.
(2) Factory Y cars have more consistent distances travelled per litre, since the standard deviation for Y is km while the standard deviation for X is km.
4((c))((ii))((a))
1. Decide how adding the new 5 cars affects the mean.
The original estimated mean for Factory Y is km.
The 5 additional cars travelled between km and km, so using the same grouped-data method, their representative value is the class midpoint
Since the added cars have the same estimated value as the original mean, the mean remains unchanged.
No change.
4((c))((ii))((b))
1. Decide the effect of adding 5 cars whose estimated value is at the existing mean.
The new 5 cars are in the km to km class, so their grouped-data estimated value is the midpoint:
This is equal to the existing mean of Factory Y, km. Adding values at the mean adds no extra spread, so the standard deviation will decrease.
Decrease.
AI 分析,可能出错
用 AI 批改,圈出写错的那一步,并自动将你的薄弱点存入错题本,形成你的错因库。
同一知识点的其他题
- 1Garcia先生调查了他健康课的学生上周有多少天他们运动了至少30分钟,结果如下图柱状图所示,其中柱的高度表示学生数。那么Garcia先生班里的学生上周平均运动的天数是多少天?结果保留到百分位。 A. 3.50 B. 3.57 C. 4.3…
- 2进行了一项调查,以统计一组学生中每人一周内收到的电子邮件数量。 下表表示调查的结果。 | 电子邮件数量 (n) | 频数 | |---|---| | | 8 | | | 13 |…
- 3累积频数曲线显示了 120 名学生在最近一次数学测试中获得的分数。满分是 100 分。 完成所得分数的分组频数表。 | 学生所得分数, x | 频数 | |---|---| | 0 ≤ x < 20 | 10 | | 20 ≤ x < 40…
- 4两家电话服务店(A 店和 B 店)各 40 名顾客的等待时间 t(单位:分钟)如下。 计算 A 店的平均等待时间。 答:___ 分钟 解释为什么你对 (a)(i) 的回答只是一个估计值。 答 ... 计算 A 店的标准差。 答:___ 分钟…
- 5约翰对每周平均阅读时间进行了一项调查。该调查是在兀兰区域图书馆外进行的。下表展示了调查结果。 | 阅读时间 (t) 小时 | | | | …