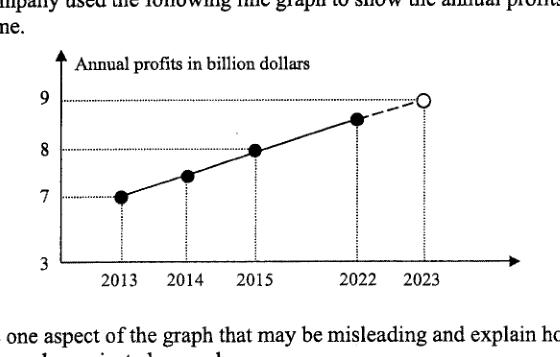
A company used the following line graph to show the annual profits made over a period of time. [Line graph shown below] State one aspect of the graph that may be misleading and explain how the annual profits in 2023 can be projected wrongly. Answer ... ...
It won't just hand you the answer — it asks where you're stuck.How the checker works
Worked solution
4
1. State one misleading aspect of the graph
The -axis scale is misleading: the labels 2013, 2014, 2015, 2022 and 2023 are shown with similar spacing, even though the time gap from 2015 to 2022 is much larger than the other gaps.
2. Explain how this affects the 2023 projection
Because the gap from 2015 to 2022 is compressed, the rise in profit appears to happen over a shorter time. Extending the line to 2023 can therefore suggest an unrealistically large increase for 2023, so the projected profit may be too high.
The horizontal axis is misleading because the years are not evenly spaced in time: the gap from 2015 to 2022 is 7 years, but it is drawn like a 1-year gap. This can make the profit appear to be increasing at a much faster yearly rate, so extending the line to 2023 may project the 2023 annual profit too high.
AI analysis — may contain mistakes.
Worked this one out on paper? Snap your steps and Gigle's AI math checker will circle the step where it went wrong.
More questions on this topic
- 1Explain how the line graph above may be misleading. Answer ...
- 2Below is a graph from the Annual Climate Singapore 2023, which shows the top 10 warmest years in Singapore since 1929. S…
- 3A website shows a poster of the poaching statistics of African elephants. Explain how the poster above may be misleading…
- 4The graph shows the number of cyclists in an annual cycling marathon for the years 2017 to 2019. State one aspect of the…
- 5A company presented their 2023 financial report in this graph. State one aspect of the graph that may be misleading and…