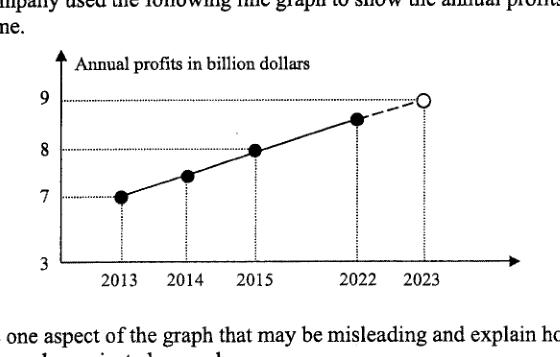
某公司使用以下折线图来展示在一段时间内获得的年利润。 [下方显示折线图] 指出该图表中可能具有误导性的一处,并解释 2023 年的年利润可能如何被错误地预测。 答 ... ...
它不会直接告诉你答案,而是问你卡在哪一步看看 AI 是怎么陪你一步步弄懂这道题的
完整解法
4
1. State one misleading aspect of the graph
The -axis scale is misleading: the labels 2013, 2014, 2015, 2022 and 2023 are shown with similar spacing, even though the time gap from 2015 to 2022 is much larger than the other gaps.
2. Explain how this affects the 2023 projection
Because the gap from 2015 to 2022 is compressed, the rise in profit appears to happen over a shorter time. Extending the line to 2023 can therefore suggest an unrealistically large increase for 2023, so the projected profit may be too high.
The horizontal axis is misleading because the years are not evenly spaced in time: the gap from 2015 to 2022 is 7 years, but it is drawn like a 1-year gap. This can make the profit appear to be increasing at a much faster yearly rate, so extending the line to 2023 may project the 2023 annual profit too high.
AI 分析,可能出错
用 AI 批改,圈出写错的那一步,并自动将你的薄弱点存入错题本,形成你的错因库。
同一知识点的其他题
- 1解释上面的折线图可能如何产生误导。 答案 ...
- 2下面是来自《2023年新加坡年度气候报告》的一张图表,显示了自1929年以来新加坡最热的10个年份。 指出该图表中可能具有误导性的一个方面,并解释这如何可能导致对图表的误读。 ...
- 3某网站展示了一幅关于非洲象偷猎统计数据的海报。 解释上述海报可能具有误导性的原因。
- 4该图表显示了 2017 年至 2019 年年度自行车马拉松赛中的骑行人数。 指出该图表中可能具有误导性的一个方面。 解释这可能会如何导致对图表的误解。
- 5一家公司在这张图表中展示了他们 2023 年的财务报告。 指出图表中可能产生误导的一个方面,并解释这可能会如何导致误解。 答案 ...