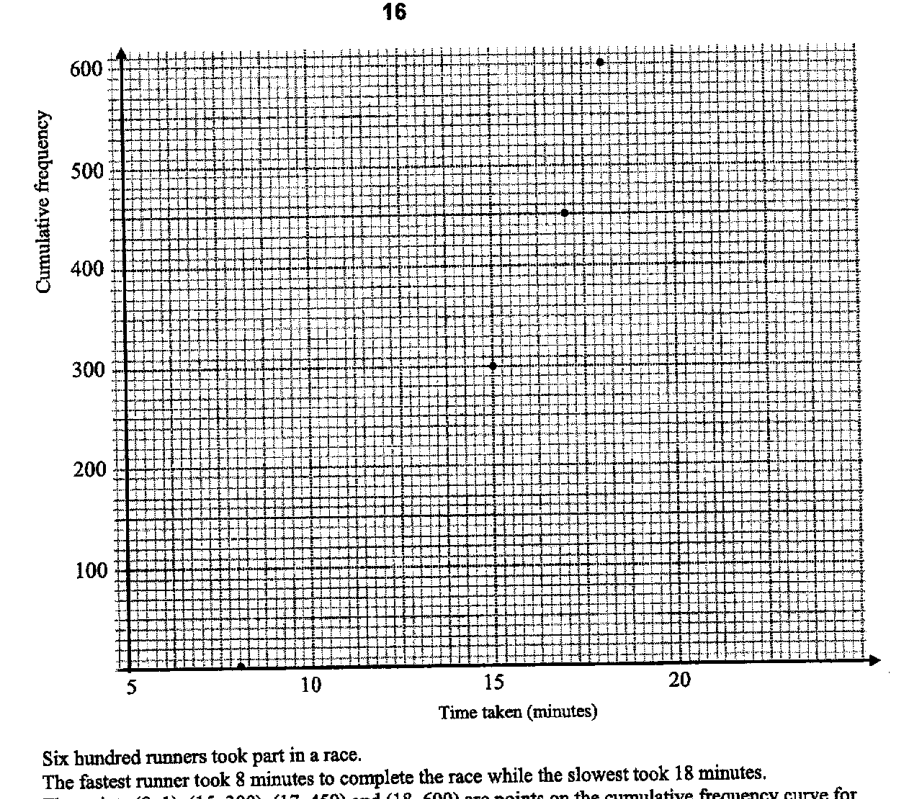
六百名选手参加了比赛。
最快的选手用了 8 分钟完成比赛,而最慢的选手用了 18 分钟。
点 (8, 1)、(15, 300)、(17, 450) 和 (18, 600) 是上方网格所示选手的累积频数曲线上的点。
已知比赛时间的四分位距为 4 分钟。
- ((i))
写出代表该累积频数曲线下四分位数的点的坐标。
答案 (___, ___)
- ((ii))
在上方网格上画出累积频数曲线。
- ((iii))
“后 10% 的选手的用时比前 10% 的选手更稳定。”
你同意上述说法吗?请清晰地说明你的理由。答案
它不会直接告诉你答案,而是问你卡在哪一步看看 AI 是怎么陪你一步步弄懂这道题的
完整解法
23((i))
1. Find the cumulative frequency corresponding to the lower quartile.
There are runners.
Lower quartile cumulative frequency:
2. Use the given interquartile time to find the lower quartile time.
The upper quartile has cumulative frequency
The point is given on the cumulative frequency curve, so
Given interquartile time is minutes,
Hence the lower quartile point is
23((ii))
1. Identify all points that the cumulative frequency curve must pass through.
From part (i), the lower quartile point is .
The given points are , , and .
So plot the points
2. Draw the cumulative frequency curve through the plotted points.
Join the plotted points with a smooth, non-decreasing curve.
The curve should start near the fastest time at minutes and rise to cumulative frequency at minutes.
A smooth increasing cumulative frequency curve passing through , , , and .
AI 分析,可能出错
用 AI 批改,圈出写错的那一步,并自动将你的薄弱点存入错题本,形成你的错因库。
同一知识点的其他题
- 1对 A、B 两家工厂生产的两批各 400 根钢条的质量进行了测量和记录。下方的累积频数图像显示了这些质量。 对于工厂 A 生产的钢条,求 中位数。 答案 ... kg 四分位距。 答案 ... kg 工厂 B 生产的钢条比工厂 A 生产的钢…
- 2茎叶图显示了某班男生和女生的测试成绩。 [茎叶图印刷为两列,左列标为“男生”(Boys),右列标为“女生”(Girls),共用中间的一列茎。键(男生)8 | 3 表示 38。键(女生)4 | 1 表示 41。] 艾尔文在下方的箱线图中表示了…
- 3该累积频数图展示了某一天在餐厅 A 消费的 60 名顾客在接受服务前的等待时间(以分钟为单位)的分布。 利用该曲线估计: 中位数等待时间, 答:... min 四分位距, 答:... min 等待时间的第 35 百分位数。 答:... mi…
- 4两家电话服务店(A 店和 B 店)各 40 名顾客的等待时间 t(单位:分钟)如下。 计算 A 店的平均等待时间。 答:___ 分钟 解释为什么你对 (a)(i) 的回答只是一个估计值。 答 ... 计算 A 店的标准差。 答:___ 分钟…
- 5某一天班上 18 名女生的体温显示在下面的茎叶图中。 (茎叶图显示在下方并在 figure_description 中重现。) 键:37 | 1 表示 已知极差为 …