本题包含 (a) 和 (b) 两部分。
- (a)
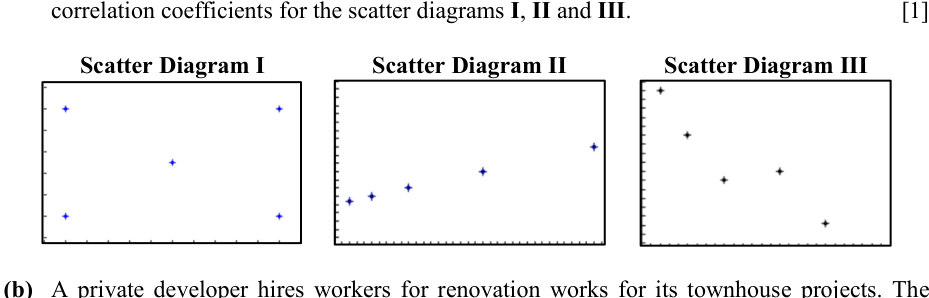
以下每个包含 5 个数据点的散点图的积矩相关系数分别为 、、,顺序不一定与给出的一致。写出散点图 I、II 和 III 的积矩相关系数。
- (b)
某私人开发商为其联排别墅项目的翻新工程雇用工人。该项目中每栋联排别墅所需的翻新工程都是相同的。该私人开发商希望研究某项目中完成一栋联排别墅翻新工程所需的工作天数 如何随雇用来翻新一栋联排别墅的工人人数 的变化而变化。开发商收集的相关数据见下表。
数值表
- (i)
为这些数值绘制散点图。利用你的图表,对线性模型是否适合用来模拟 和 之间的关系进行评述。
- (ii)
参考部分 (b)(i) 中的散点图和问题的背景,选择并解释以下模型 (A)、(B) 和 (C) 中哪一个(其中 和 是正常数)最适合用来模拟 和 之间的关系。
(A)
(B)
(C)
- (iii)
在问题的其余部分中使用部分 (b)(ii) 中最合适的模型。
求出 和 之间关系的方程,给出该模型的系数数值和积矩相关系数。
- (iv)
估计雇用 9 名工人时完成一栋联排别墅翻新工程所需的工作天数,并评论你估计的可靠性。
- (v)
该私人开发商为每位工人支付每天 $120 的固定工资。估计在开发商最多只能雇用 20 名工人的情况下,他应该雇用多少名工人才能使他必须支付的工人总工资最少。
它不会直接告诉你答案,而是问你卡在哪一步看看 AI 是怎么陪你一步步弄懂这道题的
完整解法
9(a)
1. Match the correlation coefficients based on the direction and strength of the scatter plots.
Diagram III shows a clear negative association (decreasing left to right), so its correlation coefficient must be negative, i.e., .
Diagram II shows a clear positive association, so its correlation coefficient must be positive, i.e., .
Diagram I shows a weak dispersed pattern, corresponding to the remaining coefficient of .
Diagram I:
Diagram II:
Diagram III:
9(b)(i)
1. Draw the scatter diagram by plotting the given data points.
Set up a Cartesian coordinate system with (number of workers) on the horizontal axis and (number of working days) on the vertical axis. Plot the coordinates: , , , , , , , and .
2. Analyse the shape of the plotted data to evaluate the appropriateness of a linear model.
From the scatter diagram, it is observed that as increases, decreases at a decreasing rate. The points form a distinct curve. Since they do not lie reasonably close to a straight line, a linear model is not appropriate to model the relationship between and .
[Scatter diagram accurately plotted with on the horizontal axis and on the vertical axis]
A linear model is not appropriate because the points on the scatter diagram follow a distinct curved pattern rather than a straight line.
9(b)(ii)
1. Evaluate Model (B) against the scatter diagram shape.
The scatter diagram from part (b)(i) shows a curve where decreases as increases, but the rate of decrease slows down (the gradient is negative but increasing towards 0; the graph is concave upwards).
For model (B) , since , the graph is an inverted parabola which gets steeper downwards as increases (concave downwards). This contradicts the scatter diagram, so Model (B) is rejected.
2. Evaluate Model (A) against the real-world context.
The context dictates that the number of working days must be strictly positive ().
For model (A) , as , . Since , will eventually become negative for large values of . This is impossible in the context of working days, so Model (A) is rejected.
3. Confirm Model (C) fits both the shape and context.
For model (C) , the graph decreases at a decreasing rate (matching the scatter diagram) and as , and . Since is a positive constant, remains positive, matching the contextual requirement that there is a minimum theoretical time required to finish the renovation. Thus, (C) is the most appropriate model.
Model (C) is the most appropriate.
Reasons:
- Reject (B) based on scatter diagram: The data points show decreasing at a decreasing rate (the curve flattens out as increases). However, Model (B) predicts that will decrease at an increasing rate (getting steeper downwards), which contradicts the scatter diagram.
- Reject (A) based on context: The number of working days must always be strictly positive. In Model (A) , as becomes large, will eventually become negative (since is a positive constant), which is impossible in this context.
- Model (C) fits: decreases at a decreasing rate and approaches a positive constant as , ensuring the number of days remains positive and logically sound (there is a minimum time required to complete the job regardless of how many workers are hired).
9(b)(iii)
1. Identify the chosen model from part (b)(ii) and the variables for linear regression.
From part (b)(ii), Model (C) is the most appropriate because as increases, decreases and levels off to a positive asymptote ( as ), matching the context of a minimum baseline number of renovation work days.
For the model , we use the transformed variable .
2. Compute the coefficients and the product moment correlation coefficient $r$ using a graphing calculator.
Entering the data pairs into a graphing calculator:
Performing a linear regression of on gives:
3. State the final equation for the relationship.
Substituting and into the model yields the final equation:
9(b)(iv)
1. Obtain the linear regression equation and correlation coefficient required from part (b)(iii).
From part (b)(iii), letting , we use the statistical functions of a graphing calculator on the given data to find the least squares regression line of on :
Equation:
2. Substitute $x = 9$ into the regression equation to estimate the number of working days.
Substitute into the model:
The estimated number of working days required is .
3. Comment on the reliability of the estimate.
The estimate is reliable because:
- is within the range of the given data (), so this is an interpolation.
- The product moment correlation coefficient is very close to , indicating a strong positive linear relationship between and (a strong model fit).
Estimated working days:
The estimate is reliable because lies within the given data range (interpolation), and the correlation coefficient indicates a very strong fit for the model.
9(b)(v)
1. Formulate an expression for the total wages using the regression model.
From part (b)(iii), the regression equation for Model (C) is .
Let be the total amount of workers' wages.
The wages are calculated by taking the daily rate per worker multiplied by the number of workers and the number of days:
2. Find the stationary point of the total wages function.
To minimise the wages, we differentiate with respect to and set it to :
(since )
3. Determine the optimal integer number of workers.
Since the number of workers must be an integer, we test the closest integers and .
For :
For :
The minimum total wage occurs when . As , it satisfies the maximum worker condition constraint.
6 workers
AI 分析,可能出错
用 AI 批改,圈出写错的那一步,并自动将你的薄弱点存入错题本,形成你的错因库。
同一知识点的其他题
- 1一位教师对7名学生进行了调查,以研究每周“屏幕时间”小时数()与他们在最近结束的考试中获得的平均分数()之间的关系。她将自己的调查结果记录在下表中。 已知 对 的回归线为 …
- 2下表给出了某员工在公司工作的年数()以及该员工获得的相应薪资增幅(以美元计,)。 | 年数, | 6 | 7 | 9 | 11 | 13 | 15 | 18 | |---|---|---|---|---|---|---|…
- 3据信,随机选择的孕妇生育唐氏综合征患儿的概率 与孕妇的年龄 (以岁为单位)相关。下表给出了 5 个不同的 值所对应的 的观测值。 | | 25 | 30 | 35 | 40 | 45 | |---|--…
- 4一家电器供应商正在调查在流行社交媒体平台 SnapGram 上的月度广告支出(记为 ,单位为千美元)对其月销售利润(记为 ,单位为千美元)的潜在影响。该供应商收集了过去一年中的以下数据。 这组数据被认为可以用以下方程之一进行建模…
- 5一位研究人员正在调查学生的考试成绩与他们在考试前一周的日均睡眠时间之间的关系。下表给出了 9 名学生的日均睡眠时间( 小时)和他们的考试成绩(,满分 100 分)。 | | 5.5 | 5.8 | 6.1 | 6.5 |…