The following question has parts (a) and (b).
- (a)
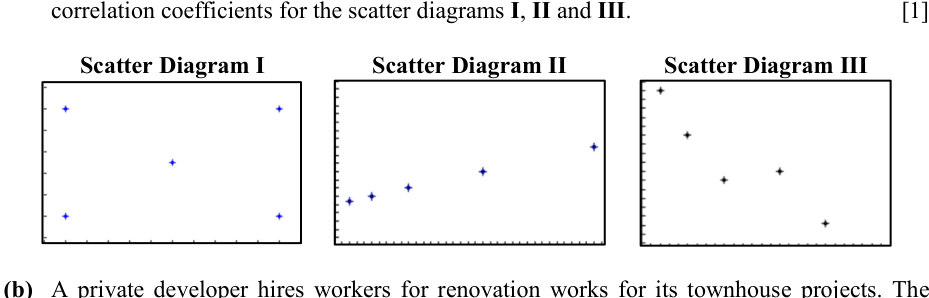
The following scatter diagrams with 5 data points each have product moment correlation coefficients , , , not necessarily in the given order. State the product moment correlation coefficients for the scatter diagrams I, II and III.
- (b)
A private developer hires workers for renovation works for its townhouse projects. The renovation works required for each townhouse in a certain project are identical. The private developer wishes to investigate how the number of working days taken to complete the renovation works for a townhouse for a certain project, , varies with the number of workers hired to renovate a townhouse, . The relevant data collected by the private developer is given in the following table.
Table of values
- (i)
Draw a scatter diagram for these values. Use your diagram to comment on whether a linear model would be appropriate to model the relationship between and .
- (ii)
By referring to the scatter diagram in part (b)(i) and the context of the question, choose and explain which one of the following models (A), (B) and (C) below, where and are positive constants, is the most appropriate for modelling the relationship between and .
(A)
(B)
(C)
- (iii)
Use the most appropriate model from part (b)(ii) for the rest of the question.
Find the equation for the relationship between and , giving the numerical values of the coefficients and the product moment correlation coefficient for this model.
- (iv)
Estimate the number of working days required to complete the renovation works for a townhouse when 9 workers are hired and comment on the reliability of your estimate.
- (v)
The private developer pays each worker a fixed amount of $120 for a day's work. Estimate the number of workers the developer should hire to minimise the total amount of workers' wages the developer will have to pay if he can only hire a maximum of 20 workers.
It won't just hand you the answer — it asks where you're stuck.How the checker works
Worked solution
9(a)
1. Match the correlation coefficients based on the direction and strength of the scatter plots.
Diagram III shows a clear negative association (decreasing left to right), so its correlation coefficient must be negative, i.e., .
Diagram II shows a clear positive association, so its correlation coefficient must be positive, i.e., .
Diagram I shows a weak dispersed pattern, corresponding to the remaining coefficient of .
Diagram I:
Diagram II:
Diagram III:
9(b)(i)
1. Draw the scatter diagram by plotting the given data points.
Set up a Cartesian coordinate system with (number of workers) on the horizontal axis and (number of working days) on the vertical axis. Plot the coordinates: , , , , , , , and .
2. Analyse the shape of the plotted data to evaluate the appropriateness of a linear model.
From the scatter diagram, it is observed that as increases, decreases at a decreasing rate. The points form a distinct curve. Since they do not lie reasonably close to a straight line, a linear model is not appropriate to model the relationship between and .
[Scatter diagram accurately plotted with on the horizontal axis and on the vertical axis]
A linear model is not appropriate because the points on the scatter diagram follow a distinct curved pattern rather than a straight line.
9(b)(ii)
1. Evaluate Model (B) against the scatter diagram shape.
The scatter diagram from part (b)(i) shows a curve where decreases as increases, but the rate of decrease slows down (the gradient is negative but increasing towards 0; the graph is concave upwards).
For model (B) , since , the graph is an inverted parabola which gets steeper downwards as increases (concave downwards). This contradicts the scatter diagram, so Model (B) is rejected.
2. Evaluate Model (A) against the real-world context.
The context dictates that the number of working days must be strictly positive ().
For model (A) , as , . Since , will eventually become negative for large values of . This is impossible in the context of working days, so Model (A) is rejected.
3. Confirm Model (C) fits both the shape and context.
For model (C) , the graph decreases at a decreasing rate (matching the scatter diagram) and as , and . Since is a positive constant, remains positive, matching the contextual requirement that there is a minimum theoretical time required to finish the renovation. Thus, (C) is the most appropriate model.
Model (C) is the most appropriate.
Reasons:
- Reject (B) based on scatter diagram: The data points show decreasing at a decreasing rate (the curve flattens out as increases). However, Model (B) predicts that will decrease at an increasing rate (getting steeper downwards), which contradicts the scatter diagram.
- Reject (A) based on context: The number of working days must always be strictly positive. In Model (A) , as becomes large, will eventually become negative (since is a positive constant), which is impossible in this context.
- Model (C) fits: decreases at a decreasing rate and approaches a positive constant as , ensuring the number of days remains positive and logically sound (there is a minimum time required to complete the job regardless of how many workers are hired).
9(b)(iii)
1. Identify the chosen model from part (b)(ii) and the variables for linear regression.
From part (b)(ii), Model (C) is the most appropriate because as increases, decreases and levels off to a positive asymptote ( as ), matching the context of a minimum baseline number of renovation work days.
For the model , we use the transformed variable .
2. Compute the coefficients and the product moment correlation coefficient $r$ using a graphing calculator.
Entering the data pairs into a graphing calculator:
Performing a linear regression of on gives:
3. State the final equation for the relationship.
Substituting and into the model yields the final equation:
9(b)(iv)
1. Obtain the linear regression equation and correlation coefficient required from part (b)(iii).
From part (b)(iii), letting , we use the statistical functions of a graphing calculator on the given data to find the least squares regression line of on :
Equation:
2. Substitute $x = 9$ into the regression equation to estimate the number of working days.
Substitute into the model:
The estimated number of working days required is .
3. Comment on the reliability of the estimate.
The estimate is reliable because:
- is within the range of the given data (), so this is an interpolation.
- The product moment correlation coefficient is very close to , indicating a strong positive linear relationship between and (a strong model fit).
Estimated working days:
The estimate is reliable because lies within the given data range (interpolation), and the correlation coefficient indicates a very strong fit for the model.
9(b)(v)
1. Formulate an expression for the total wages using the regression model.
From part (b)(iii), the regression equation for Model (C) is .
Let be the total amount of workers' wages.
The wages are calculated by taking the daily rate per worker multiplied by the number of workers and the number of days:
2. Find the stationary point of the total wages function.
To minimise the wages, we differentiate with respect to and set it to :
(since )
3. Determine the optimal integer number of workers.
Since the number of workers must be an integer, we test the closest integers and .
For :
For :
The minimum total wage occurs when . As , it satisfies the maximum worker condition constraint.
6 workers
AI analysis — may contain mistakes.
Worked this one out on paper? Snap your steps and Gigle's AI math checker will circle the step where it went wrong.
More questions on this topic
- 1A teacher conducts a survey on 7 students to investigate the relationship between the number of hours () of "screen-t…
- 2The number of years () an employee has worked for the company and the corresponding salary increment, in dollars (…
- 3It is believed that the probability of a randomly chosen pregnant woman giving birth to a Down's Syndrome child is r…
- 4An electrical appliance supplier is investigating the potential impact of monthly advertisement expenditure, denoted as…
- 5A researcher is investigating the relationship between the students' test marks and their average daily duration of slee…