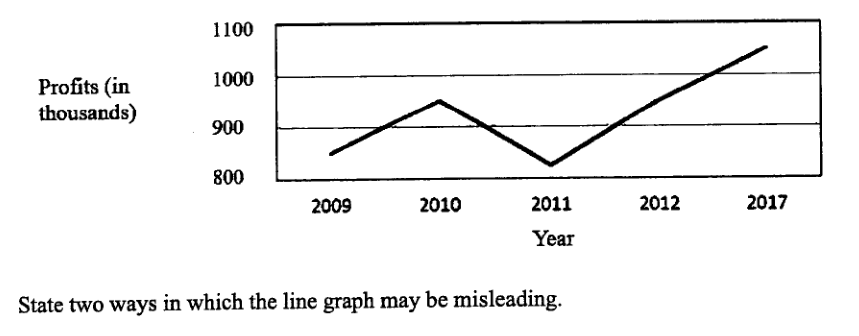
The line graph shows the profits that a company has made over a few years.
State two ways in which the line graph may be misleading.
Answer ...
...
It won't just hand you the answer — it asks where you're stuck.How the checker works
Worked solution
2
1. Identify the misleading vertical scale
The -axis for profits starts at instead of . This truncates the scale, making differences between profits look larger than they really are.
2. Identify the misleading horizontal scale
The -axis has years , but the spacing shown is not proportional to time. In particular, the interval from to is years, not year, so the line may mislead about the rate of increase.
Answer
Two ways the graph may be misleading are:
- The vertical axis does not start at ; it starts at , so the changes in profit look exaggerated.
- The years on the horizontal axis are not evenly spaced; the gap from to represents years but is drawn like the other -year gaps, so the rate of change is misleading.
AI analysis — may contain mistakes.
Worked this one out on paper? Snap your steps and Gigle's AI math checker will circle the step where it went wrong.
More questions on this topic
- 1Explain how the line graph above may be misleading. Answer ...
- 2Below is a graph from the Annual Climate Singapore 2023, which shows the top 10 warmest years in Singapore since 1929. S…
- 3A website shows a poster of the poaching statistics of African elephants. Explain how the poster above may be misleading…
- 4The graph shows the number of cyclists in an annual cycling marathon for the years 2017 to 2019. State one aspect of the…
- 5A company presented their 2023 financial report in this graph. State one aspect of the graph that may be misleading and…