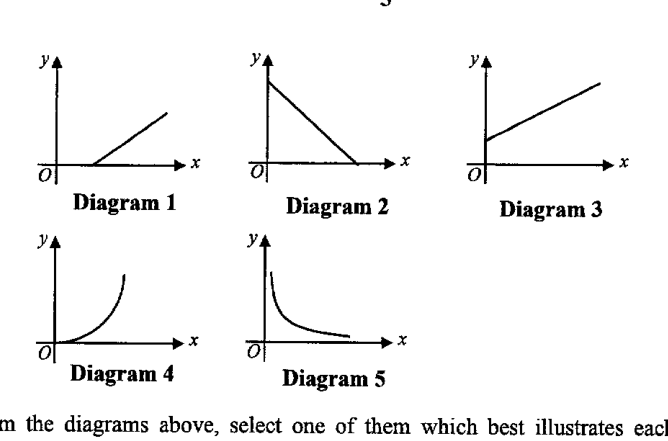
根据上方的图示,选择最能说明以下各项陈述的一幅图。
- (a)
。
- (b)
一个项目的成本 是 的线性函数,其中 是完成该项目所需的工时数。该项目的固定成本为 $100。
- (c)
一个物体正以恒定的速度向固定点 O 移动。距离 y(以米为单位)表示在时间 x(以分钟为单位)时,该物体距离点 O 的距离。
它不会直接告诉你答案,而是问你卡在哪一步看看 AI 是怎么陪你一步步弄懂这道题的
完整解法
6(a)
1. Match the cubic function to its graph shape
is of the form , where and .
For positive , increases from the origin and rises more steeply as increases. This matches the increasing curve through the origin in Diagram 4.
Diagram 4
6(b)
1. Match the cost model to the correct graph shape
Since is a linear function of , the graph is a straight line.
The fixed cost is $100, so when , . Hence the graph has a positive -intercept and increases as the number of man-hours increases.
This matches Diagram 3.
Diagram 3
6(c)
1. Identify the correct graph shape from the motion described
The object travels at a constant speed towards point O, so its distance from O decreases at a constant rate as time increases.
Hence the graph of against is a straight line with negative gradient. This matches Diagram 2.
Diagram 2
AI 分析,可能出错
用 AI 批改,圈出写错的那一步,并自动将你的薄弱点存入错题本,形成你的错因库。
同一知识点的其他题
- 1草图显示了 的图像。点 A(-2, -0.75) 和 B(0, -3) 位于图像上。 求 和 的值。 答案 k = a = 写出平行于 x 轴且穿过点 B 的直线的方程。
- 2在下方空白处画出函数图像。 由此,确定方程 的解的个数。
- 3y 与 x 的平方成反比,。 如果 x 增加了 25%,求 y 的百分比变化。 答案 ...% 已知当 时 ,求 连接 y 和 x 的方程。 答案 ... 当 …
- 4变量 x 和 y 由方程 联系起来。 下表给出了 x 和 y 的一些对应值。 求 p 的值。 答:... 在对面的网格上,描出表中给出的点,并用平滑的曲线将它们连接起来。 利用你的图象估计在…
- 5完成 的值表。 在适当的地方,数值保留到一位小数。 完成 的值表。在适当的地方,数值保留到一位小数。 在第 11 页的网格上,画出 …