一组学生被要求完成一次课堂测试。完成测试所花费的时间如以下表格所示:
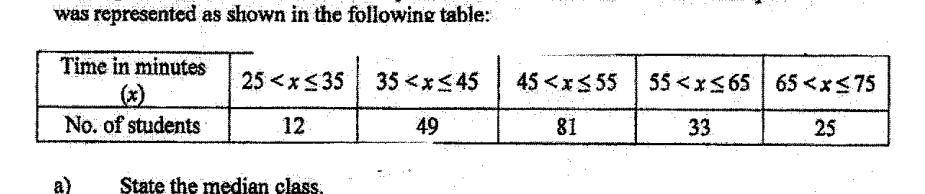
- (a)
写出中位数所在的组(中位数类)。
答案
- (b)
如果测试中增加了一道题,且每位学生多花 5 分钟来完成测试,请评述这将如何影响数据的平均数和标准差。
答案 ...
它不会直接告诉你答案,而是问你卡在哪一步看看 AI 是怎么陪你一步步弄懂这道题的
完整解法
5(a)
1. Find the position of the median value and locate it using cumulative frequencies.
Total number of students:
The median lies between the th and st values.
Cumulative frequencies:
Since the th and st values lie in the class where the cumulative frequency reaches , the median class is .
minutes
5(b)
1. State the effect on the mean when every student's time increases by 5 minutes.
Each time value becomes .
Therefore the mean also increases by minutes.
2. State the effect on the standard deviation when every data value is increased by the same amount.
Adding minutes to every time value does not change the differences of the values from the mean.
Hence the spread of the data is unchanged, so the standard deviation remains the same.
The mean will increase by minutes. The standard deviation will remain unchanged.
AI 分析,可能出错
用 AI 批改,圈出写错的那一步,并自动将你的薄弱点存入错题本,形成你的错因库。
同一知识点的其他题
- 1对 A、B 两家工厂生产的两批各 400 根钢条的质量进行了测量和记录。下方的累积频数图像显示了这些质量。 对于工厂 A 生产的钢条,求 中位数。 答案 ... kg 四分位距。 答案 ... kg 工厂 B 生产的钢条比工厂 A 生产的钢…
- 2下图显示了一辆公共汽车行驶过程中的速度-时间图像。 公共汽车在 20 秒内从静止以 1.25 m/s^2 的加速度加速到 v m/s 的速度,并保持该速度行驶到第 T 秒,然后在第 80 秒时停止。 全程行驶的总路程为 1450 m。 求下…
- 3茎叶图显示了某班男生和女生的测试成绩。 [茎叶图印刷为两列,左列标为“男生”(Boys),右列标为“女生”(Girls),共用中间的一列茎。键(男生)8 | 3 表示 38。键(女生)4 | 1 表示 41。] 艾尔文在下方的箱线图中表示了…
- 4解释上面的折线图可能如何产生误导。 答案 ...
- 5该图表显示了某商场的销售额。 解释为什么平均销售额不能很好地作为集中趋势的度量。