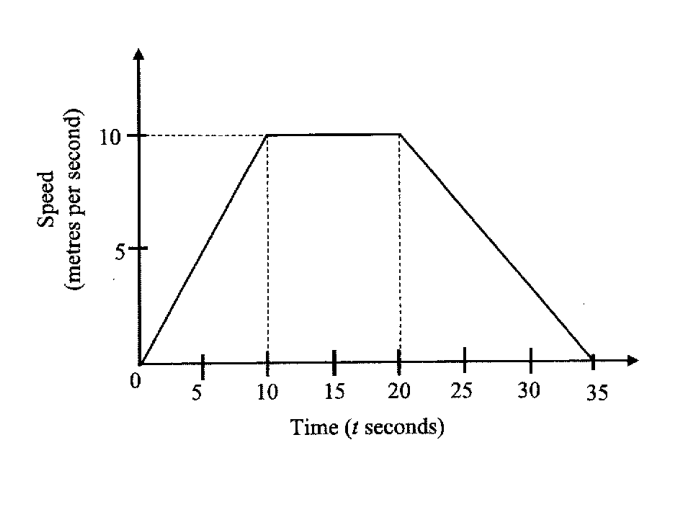
上图显示了一个质点的速度-时间图像。
- (a)
求:
- (i)
当 t = 25 时的速度,
答案 ... m/s
- (ii)
前 35 秒内经过的路程。
答案 ... m
- (i)
- (b)
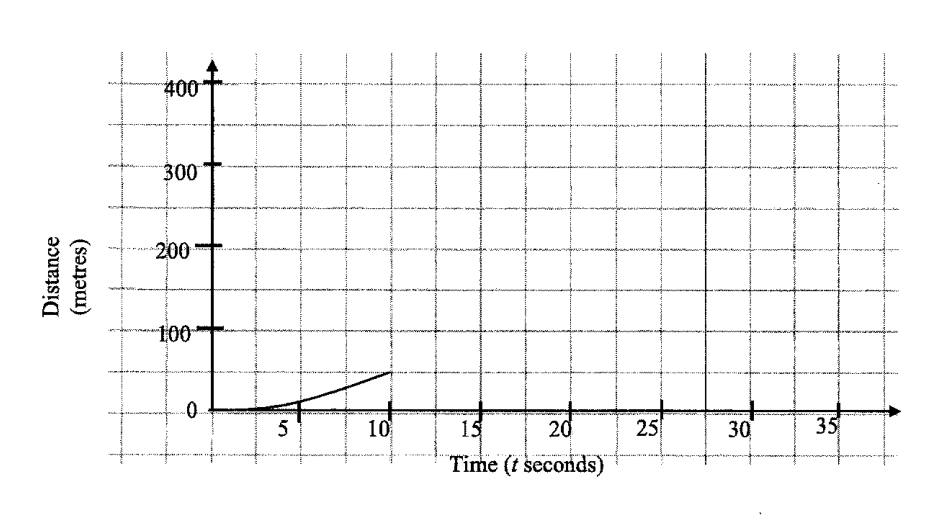
答题区域中给出了同一质点的部分路程-时间图像。
完成此图像。
它不会直接告诉你答案,而是问你卡在哪一步看看 AI 是怎么陪你一步步弄懂这道题的
完整解法
22(a)(i)
1. Identify the relevant straight-line section and find its gradient
For , the graph is a straight line from to .
Gradient m/s per second.
2. Calculate the speed at $t=25$ using the constant rate of decrease
From to , time elapsed s.
Decrease in speed m/s.
Speed at :
or
22(a)(ii)
1. Identify and calculate the three areas under the speed-time graph
Distance covered in the first seconds = area under the speed-time graph.
From to s: triangle
From to s: rectangle
From to s: triangle
2. Add the component distances to obtain the total distance
Total distance
22(b)
1. Identify the key distance values to plot on the distance-time graph
From part (a)(ii), the total distance in the first seconds is .
The intermediate distances are found from the areas under the speed-time graph:
At ,
At ,
So the key points are
2. Draw the correct distance-time graph shape using the changing speed
Since the speed is the gradient of the distance-time graph:
- from to seconds, speed increases, so the graph rises with increasing gradient: draw a concave-up curve to ;
- from to seconds, speed is constant at , so draw a straight line to ;
- from to seconds, speed decreases to , so draw a rising concave-down curve to , ending horizontal.
Complete the distance-time graph by drawing:
- a smooth concave-up curve from to ,
- a straight line from to ,
- a smooth concave-down curve from to , ending horizontal at .
The final distance is .
AI 分析,可能出错
用 AI 批改,圈出写错的那一步,并自动将你的薄弱点存入错题本,形成你的错因库。
同一知识点的其他题
- 1洪太太经营着一家面向中学生的小型补习中心。表格提供了运营该中心的成本信息。该中心在周一和周二关闭。 洪太太向银行贷款支付装修费用,年单利为 2%。她选择分 30 个月偿还。计算洪太太每月需向银行支付的月供。 答:$ ___ 洪太太以 15…
- 2图(未按比例绘制)显示了一辆车的速度-时间图像。车辆从静止开始在 15 秒内匀加速到 20 m/s 的速度。然后它以该速度行驶,最后以 1 m/s^2 的加速度匀减速直至停止。 求车辆在第 10 秒时的速度。 总路程为 950 m,车辆共用…
- 3Hamid 贷款买车,贷款期限为 3 年,年单利利率为 3.5%。 如果 Hamid 支付的总利息为 $10 374,求他贷款的金额。 答案 $ ... 下表显示了 Hamid 收集的关于他在 2023 年驾驶情况的信息。 | 描述 |…
- 4图中显示了一个港口 H、一个灯塔 L 以及两个浮标 P 和 Q 的位置。HPQ 是一条直线。从 H 观测 P 的方位角为 306°。HP = 3 km,PL = 2.5 km,且角 HPL = 124°。 求以下各项的方位角: 从 P 处观…
- 5下图显示了一辆公共汽车行驶过程中的速度-时间图像。 公共汽车在 20 秒内从静止以 1.25 m/s^2 的加速度加速到 v m/s 的速度,并保持该速度行驶到第 T 秒,然后在第 80 秒时停止。 全程行驶的总路程为 1450 m。 求下…