图中显示了曲线 。该曲线穿过点 、、 和 。 在不同的且标记清晰的图上,分别画出下列函数的草图:
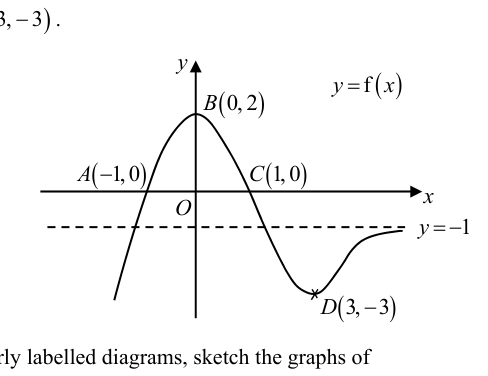
- (a)
,
- (b)
。
它不会直接告诉你答案,而是问你卡在哪一步看看 AI 是怎么陪你一步步弄懂这道题的
完整解法
2(a)
1. Determine the new coordinates of the given points by multiplying their $y$-coordinates by $-\frac{1}{2}$.
The transformation affects only the -coordinates of the graph (a vertical scaling by factor and a reflection in the -axis).
2. Determine the transformed horizontal asymptote and the correct shape of the curve.
The original horizontal asymptote is . Multiplying by gives the new asymptote:
Since the original curve approaches from below (i.e. values are more negative than ), the new curve will approach from above.
The local maximum becomes a local minimum, and the local minimum becomes a local maximum. Draw a smooth curve passing through these points with the specified features.
A sketched curve passing through and , with a local minimum at , a local maximum at , and approaching the horizontal asymptote from above as gets large.
2(b)
1. Determine the transformation of coordinates.
Let a point on be . For the new graph , setting means . The transformation maps every original point to .
2. Calculate the new coordinates of the key points.
Apply to the given points:
- Maximum
- Minimum
3. Determine the new behavior of the asymptote.
The original graph has an asymptote as . For the transformed graph, as , the new -coordinate becomes . Thus, the horizontal asymptote is as .
A correctly drawn sketch with the following features:
- Passes through and
- Local maximum at
- Local minimum at
- Horizontal asymptote approached from below as
AI 分析,可能出错
用 AI 批改,圈出写错的那一步,并自动将你的薄弱点存入错题本,形成你的错因库。