The diagram shows the curve . The curve passes through the points , , and . On separate clearly labelled diagrams, sketch the graphs of
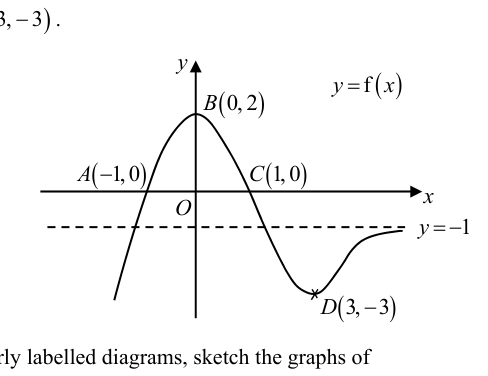
- (a)
,
- (b)
.
It won't just hand you the answer — it asks where you're stuck.How the checker works
Worked solution
2(a)
1. Determine the new coordinates of the given points by multiplying their $y$-coordinates by $-\frac{1}{2}$.
The transformation affects only the -coordinates of the graph (a vertical scaling by factor and a reflection in the -axis).
2. Determine the transformed horizontal asymptote and the correct shape of the curve.
The original horizontal asymptote is . Multiplying by gives the new asymptote:
Since the original curve approaches from below (i.e. values are more negative than ), the new curve will approach from above.
The local maximum becomes a local minimum, and the local minimum becomes a local maximum. Draw a smooth curve passing through these points with the specified features.
A sketched curve passing through and , with a local minimum at , a local maximum at , and approaching the horizontal asymptote from above as gets large.
2(b)
1. Determine the transformation of coordinates.
Let a point on be . For the new graph , setting means . The transformation maps every original point to .
2. Calculate the new coordinates of the key points.
Apply to the given points:
- Maximum
- Minimum
3. Determine the new behavior of the asymptote.
The original graph has an asymptote as . For the transformed graph, as , the new -coordinate becomes . Thus, the horizontal asymptote is as .
A correctly drawn sketch with the following features:
- Passes through and
- Local maximum at
- Local minimum at
- Horizontal asymptote approached from below as
AI analysis — may contain mistakes.
Worked this one out on paper? Snap your steps and Gigle's AI math checker will circle the step where it went wrong.
More questions on this topic
- 1将函数的图象保持纵坐标不变,先将横坐标缩短为原来的,再向右平移个单位长度后得到,则的解析式为…
- 2By expressing the equation of the curve in the form , where …
- 3A curve has the equation where . Sketch , stating the coordinates of any points o…
- 4The diagram shows the graphs of and . The graph of has t…
- 5The curve with equation is transformed to curve by a translation of …