该图显示了一个质点的速度-时间图象。
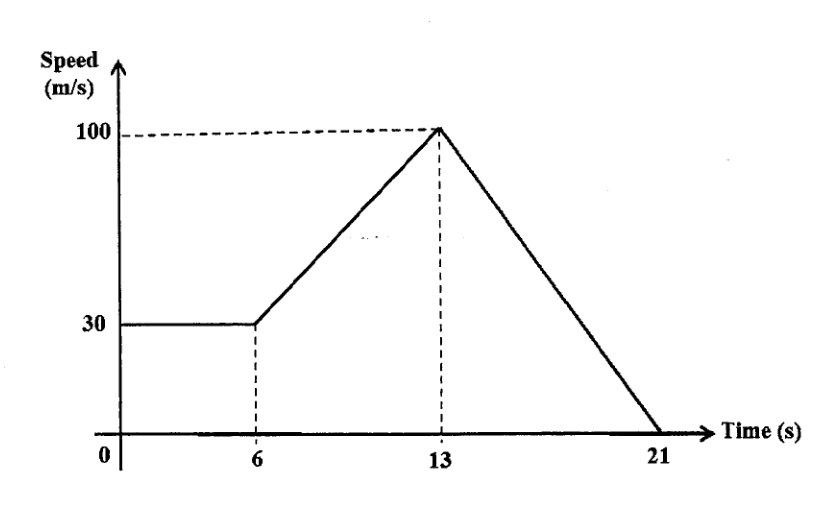
- (a)
求当 s 时质点的速度。
答案 ...m/s
- (b)
求质点开始减速前所经过的路程。
答案 ...m
- (c)
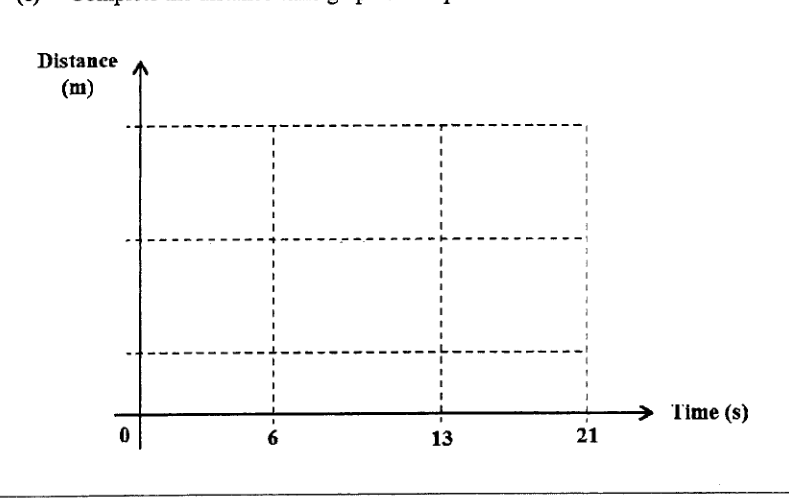
完成该质点的路程-时间图象。
它不会直接告诉你答案,而是问你卡在哪一步看看 AI 是怎么陪你一步步弄懂这道题的
完整解法
22(a)
1. Find the increase in speed per second on the straight-line section from $6$ s to $13$ s.
From to , the speed increases from m/s to m/s.
2. Use the linear increase to find the speed at $t=12$ s.
At , the time elapsed after is
So the speed is
m/s
22(b)
1. Identify the required region under the speed-time graph before slowing down.
The particle starts to slow down at s.
Distance covered before this is the area under the speed-time graph from to s.
2. Find the distance from $0$ s to $6$ s using the rectangular area.
From to s, speed is constant at m/s.
3. Find the distance from $6$ s to $13$ s using the trapezium area, then add the distances.
From to s, the speeds are m/s and m/s.
Total distance before slowing down:
m
22(c)
1. Identify the key distances and use the speeds to decide the shape of the distance-time graph.
From earlier parts,
From s to s, the extra distance is the triangular area under the speed-time graph:
So
On the distance-time graph, draw through these positions if the scale allows. The gradient represents speed, so:
- : constant speed, so draw a straight line.
- : speed increases, so draw a curve getting steeper.
- : speed decreases to , so draw a curve getting less steep, ending horizontally.
Draw a distance-time graph passing through the key distances , , and if the vertical scale allows, with:
- a straight line from to s,
- a curve getting steeper from to s,
- a curve getting less steep from to s, ending with zero gradient at s.
AI 分析,可能出错
用 AI 批改,圈出写错的那一步,并自动将你的薄弱点存入错题本,形成你的错因库。
同一知识点的其他题
- 1图(未按比例绘制)显示了一辆车的速度-时间图像。车辆从静止开始在 15 秒内匀加速到 20 m/s 的速度。然后它以该速度行驶,最后以 1 m/s^2 的加速度匀减速直至停止。 求车辆在第 10 秒时的速度。 总路程为 950 m,车辆共用…
- 2下图显示了一辆公共汽车行驶过程中的速度-时间图像。 公共汽车在 20 秒内从静止以 1.25 m/s^2 的加速度加速到 v m/s 的速度,并保持该速度行驶到第 T 秒,然后在第 80 秒时停止。 全程行驶的总路程为 1450 m。 求下…
- 3如果一次函数是常数,的图象过点,那么的值随的增大而___填“增大”或“减小”.
- 4变量 x 和 y 由方程 联系起来。 下表给出了 x 和 y 的一些对应值。 求 p 的值。 答:... 在对面的网格上,描出表中给出的点,并用平滑的曲线将它们连接起来。 利用你的图象估计在…
- 5下图显示了一辆汽车行驶的速度-时间图像。 对于这次行驶,计算 前 40 秒内的加速度, 答案 ... m/s^2 行驶的总路程。 答案 ... m