A ball was thrown up from the top of a cliff as shown below. The height of the ball, h metre, from the sea level is measured, t seconds after leaving the cliff. The table below shows the height, h, reached by the ball after time t.
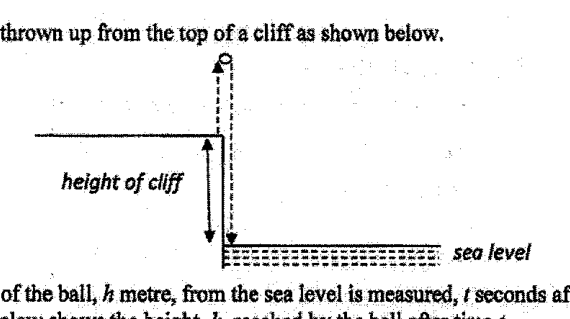
- (a)
Using a horizontal scale of 2 cm to represent 0.5 s and vertical scale of 1 cm to represent 2 m, plot the graph of h against t on a piece of graph paper.
- (b)
From the graph, find
- (i)
the height of the cliff.
Answer ___ m
- (ii)
the time when the ball reached the sea level.
Answer ___ s
- (i)
- (c)
- (i)
By drawing a tangent, find the gradient of the graph when t = 2 s.
Answer ___
- (ii)
Explain briefly what this gradient represents.
Answer ...
- (i)
- (d)
A man operates a toy plane at the top of the cliff. The toy plane travels in a straight line with an equation,
.
By adding a straight line to your graph, find the time when the toy plane collides with the ball.
Answer ___ s
- (e)
The equation of the curve can be represented in the form
,
where A and B are positive real numbers. Using your graph, estimate the value of A and of B.
Answer A =
B =
It won't just hand you the answer — it asks where you're stuck.How the checker works
Worked solution
11(a)
1. Draw and label the axes using the required scales.
Horizontal axis: in seconds, using to represent .
Vertical axis: in metres, using to represent .
The vertical axis should include values from below up to at least about , since the table includes and a maximum height slightly above .
2. Plot all given coordinate points accurately.
Plot the points:
3. Join the plotted points appropriately.
Join the plotted points with a smooth curve, not with straight line segments, since the data represents the curved path of the ball.
Graph of against plotted using the given scales, with the points , , , , , , , and joined by a smooth curve.
11(b)(i)
1. Identify the initial height of the ball, which is the height of the cliff.
At , the ball has just left the top of the cliff.
From the graph/table, when , .
Hence, the height of the cliff is m.
m
11(b)(ii)
1. Identify where the ball reaches sea level on the graph.
Sea level means the height from sea level is .
On the graph of against , read the value of where the curve crosses the horizontal axis .
This gives approximately
s
11(c)(i)
1. Draw the tangent at $t=2$ on the graph.
On the graph, locate the point on the curve where . From the table/graph, this point is approximately . Draw a straight line that just touches the curve at this point and follows the local direction of the curve.
2. Calculate the gradient of the tangent.
Choose two clear points on the tangent and calculate
From a correctly drawn tangent, the gradient is approximately
Approximately
11(c)(ii)
1. Interpret the gradient of the height-time graph in the context of the motion.
For a graph of against ,
Hence the gradient represents the rate of change of the ball's height with time, i.e. its vertical velocity at that instant.
The gradient represents the vertical velocity of the ball at s.
11(d)
1. Draw the straight line representing the toy plane on the existing graph.
For the line , choose two convenient points:
When , .
When , .
Plot and , then join them with a straight line.
2. Read the collision time from the intersection of the two graphs.
The toy plane collides with the ball when both have the same height at the same time.
This is the point where the line intersects the curve of the ball.
From the graph, the intersection occurs at about
s
11(e)
1. Recognise what $A$ and $B$ represent in the given form.
The equation is
Since , the maximum value of occurs when
so
Hence the vertex, or highest point, of the graph is .
2. Read the maximum point from the graph.
From the graph, the highest point of the curve is approximately
Therefore,
,
AI analysis — may contain mistakes.
Worked this one out on paper? Snap your steps and Gigle's AI math checker will circle the step where it went wrong.
More questions on this topic
- 1The variables x and y are connected by the equation . Some corresponding values of x and y are g…
- 2数对和表示的位置是一样的。 ___判断对错
- 3Complete the table of values for . Values are given to one decimal place where appropriate. Compl…
- 4The variables x and y are connected by the equation Some corresponding values of x and y are…
- 5The variables x and y are connected by the equation . Some corresponding values of x and y a…