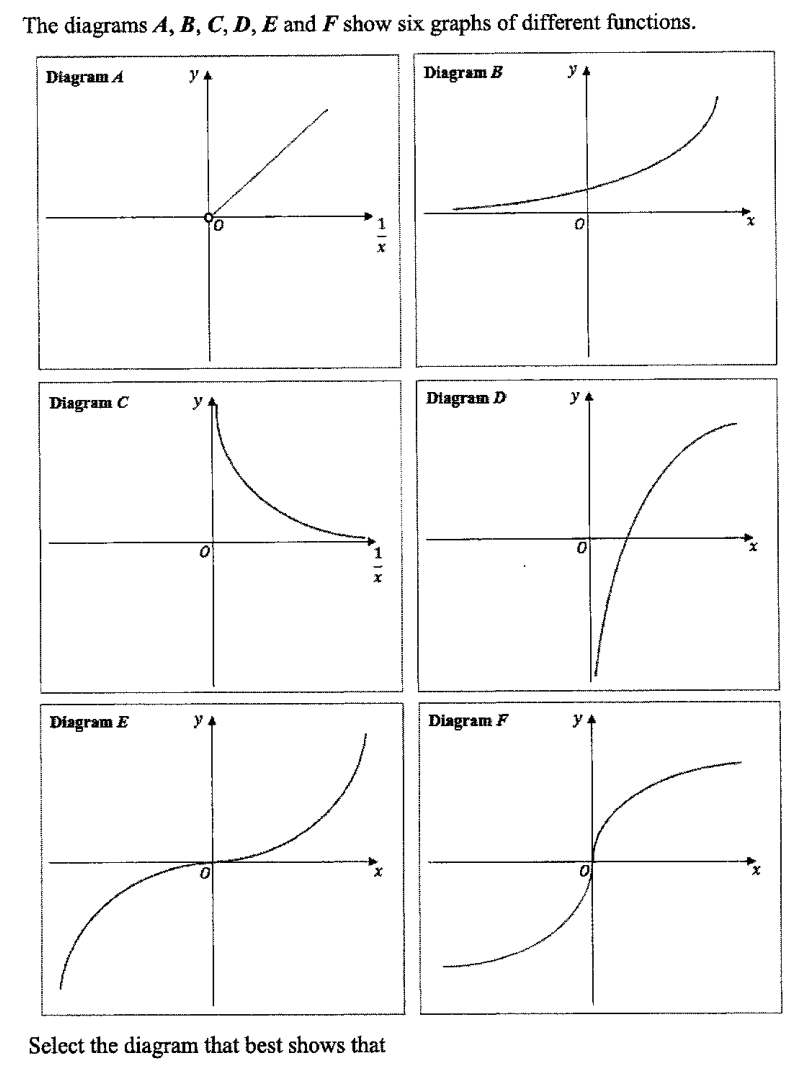
The diagrams A, B, C, D, E and F show six graphs of different functions.
- (a)
is inversely proportional to ,
Diagram ...
- (b)
, where is an odd integer greater than 1,
Diagram ...
- (c)
, where is an integer greater than 1.
Diagram ...
It won't just hand you the answer — it asks where you're stuck.How the checker works
Worked solution
6(a)
1. Identify the graph shape for inverse proportionality and match it to the diagram
If is inversely proportional to , then
For positive and , the graph is a decreasing reciprocal curve in the first quadrant, approaching both axes. This matches Diagram C.
Diagram C
6(b)
1. Identify the graph shape for $y=x^n$ with odd $n>1$ and match it to the diagram
For , where is an odd integer greater than , the graph is an increasing S-shaped curve passing through the origin, with negative -values for negative and positive -values for positive .
This matches Diagram E.
Diagram E
6(c)
1. Identify and match the exponential graph shape
For where , the graph is an increasing exponential curve with for all , and it becomes steeper as increases.
This matches Diagram B.
Diagram B
AI analysis — may contain mistakes.
Worked this one out on paper? Snap your steps and Gigle's AI math checker will circle the step where it went wrong.
More questions on this topic
- 1The sketch shows the graph of . The points A(-2, -0.75) and B(0, -3) lie on the graph. Find the values of …
- 2Sketch the graph in the spaces below. Hence, state the number of solutions for the equat…
- 3y is inversely proportional to the square of x, . If x is increased by 25%, find the percentage change in y. Answ…
- 4The variables x and y are connected by the equation . Some corresponding values of x and y are g…
- 5Complete the table of values for . Values are given to one decimal place where appropriate. Compl…