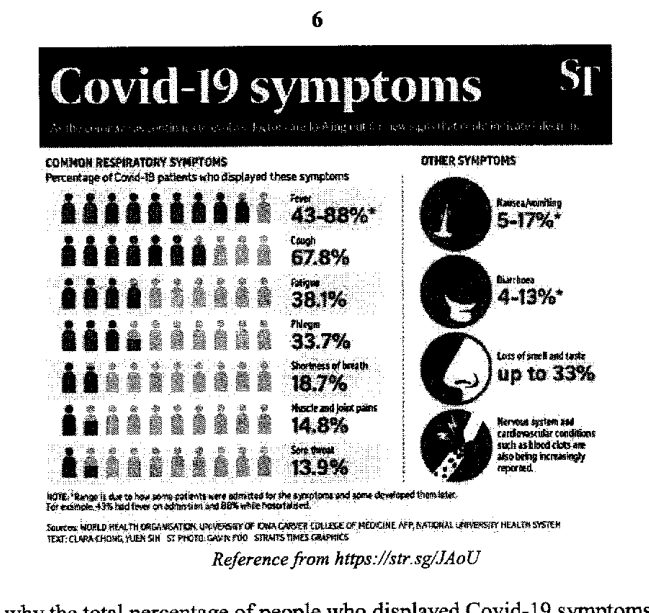
The diagram shows the percentages of Covid-19 patients who displayed various symptoms.
- (a)
Explain why the total percentage of people who displayed Covid-19 symptoms adds up to more than 100%.
- (b)
Explain whether it is appropriate to represent the data on a pie chart.
It won't just hand you the answer — it asks where you're stuck.How the checker works
Worked solution
8(a)
1. Explain why the listed percentages can overlap
The percentages are for each symptom separately. A Covid-19 patient can have several symptoms, for example both fever and cough, so the same patient may be included in more than one percentage.
The total is more than because one patient may display more than one symptom, so the symptom percentages overlap and are counted more than once.
8(b)
1. Justify whether a pie chart is suitable for the symptom data
A pie chart shows how one whole is divided into non-overlapping categories that add to . Here, one patient may display more than one symptom, so the symptom categories overlap and the percentages add to more than . Hence, a pie chart is not appropriate.
No. A pie chart is not appropriate because patients may have more than one symptom, so the categories overlap and the percentages do not form parts of a single whole adding to .
AI analysis — may contain mistakes.
Worked this one out on paper? Snap your steps and Gigle's AI math checker will circle the step where it went wrong.
More questions on this topic
- 1The masses of two batches of 400 steel bars produced by factory A and B were measured and recorded. The cumulative frequ…
- 2The diagram below shows the speed-time graph of a bus journey. The bus accelerated from rest at 1.25 m/s^2 to a speed of…
- 3The stem-and-leaf diagram shows the test scores of the boys and girls from a particular class. [Stem-and-leaf diagram pr…
- 4Explain how the line graph above may be misleading. Answer ...
- 5The graph shows the sales at a particular mall. Explain why the mean sales is not a good indication as a central measure…