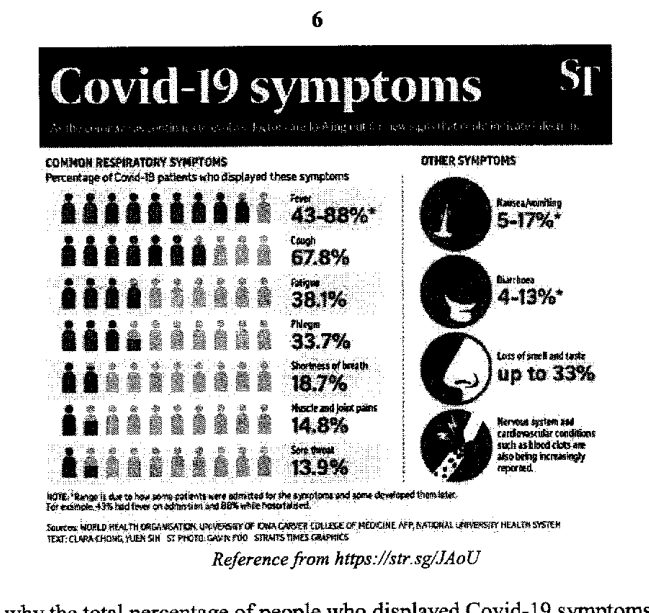
图表显示了表现出各种症状的新冠肺炎 (Covid-19) 患者的百分比。
- (a)
解释为什么表现出新冠肺炎症状的人的总百分比加起来超过 100%。
- (b)
解释将这些数据呈现在饼图上是否合适。
它不会直接告诉你答案,而是问你卡在哪一步看看 AI 是怎么陪你一步步弄懂这道题的
完整解法
8(a)
1. Explain why the listed percentages can overlap
The percentages are for each symptom separately. A Covid-19 patient can have several symptoms, for example both fever and cough, so the same patient may be included in more than one percentage.
The total is more than because one patient may display more than one symptom, so the symptom percentages overlap and are counted more than once.
8(b)
1. Justify whether a pie chart is suitable for the symptom data
A pie chart shows how one whole is divided into non-overlapping categories that add to . Here, one patient may display more than one symptom, so the symptom categories overlap and the percentages add to more than . Hence, a pie chart is not appropriate.
No. A pie chart is not appropriate because patients may have more than one symptom, so the categories overlap and the percentages do not form parts of a single whole adding to .
AI 分析,可能出错
用 AI 批改,圈出写错的那一步,并自动将你的薄弱点存入错题本,形成你的错因库。
同一知识点的其他题
- 1对 A、B 两家工厂生产的两批各 400 根钢条的质量进行了测量和记录。下方的累积频数图像显示了这些质量。 对于工厂 A 生产的钢条,求 中位数。 答案 ... kg 四分位距。 答案 ... kg 工厂 B 生产的钢条比工厂 A 生产的钢…
- 2下图显示了一辆公共汽车行驶过程中的速度-时间图像。 公共汽车在 20 秒内从静止以 1.25 m/s^2 的加速度加速到 v m/s 的速度,并保持该速度行驶到第 T 秒,然后在第 80 秒时停止。 全程行驶的总路程为 1450 m。 求下…
- 3茎叶图显示了某班男生和女生的测试成绩。 [茎叶图印刷为两列,左列标为“男生”(Boys),右列标为“女生”(Girls),共用中间的一列茎。键(男生)8 | 3 表示 38。键(女生)4 | 1 表示 41。] 艾尔文在下方的箱线图中表示了…
- 4解释上面的折线图可能如何产生误导。 答案 ...
- 5该图表显示了某商场的销售额。 解释为什么平均销售额不能很好地作为集中趋势的度量。