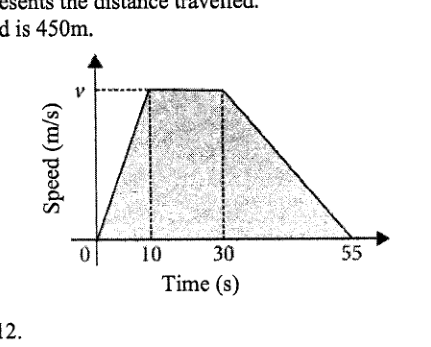
The diagram shows the speed-time graph of a motorcyclist.
The shaded area represents the distance travelled.
The distance travelled is 450 m.
- (a)
Show that .
Answer
- (b)
Find the speed of the motorcyclist after 8 seconds.
Ans: ___ m/s
- (c)
Describe the motion of the motorcyclist between 10 and 30 seconds.
Answer
- (d)
Find the deceleration of the motorcyclist for the last 25 seconds.
Ans: ___ m/s^2
- (e)
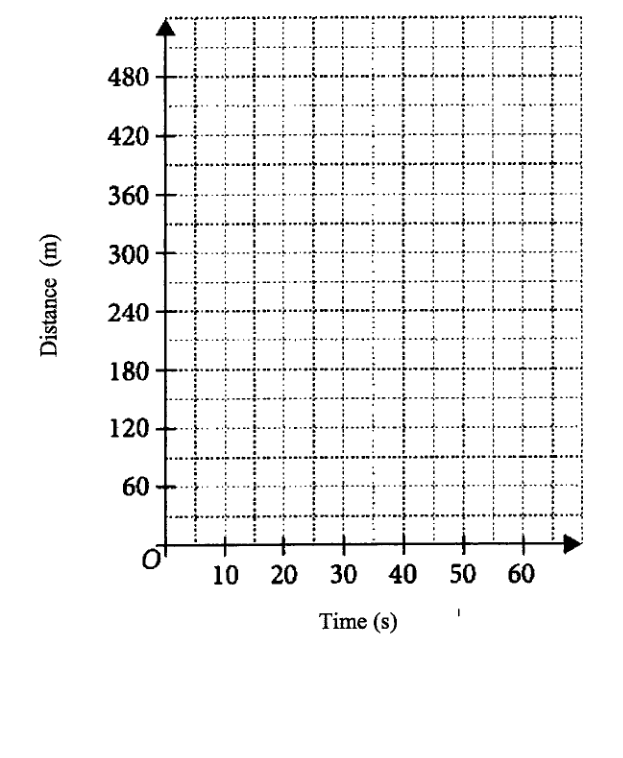
Sketch the distance time graph for the journey on the grid.
Answer
It won't just hand you the answer — it asks where you're stuck.How the checker works
Worked solution
5(a)
1. Express the total distance as the area under the speed-time graph in terms of $v$.
Distance travelled = area under the speed-time graph
2. Solve the resulting linear equation for $v$.
Hence, .
5(b)
1. Find the acceleration during the first 10 seconds from the gradient of the speed-time graph.
From part (a), .\n\nFor , the speed increases uniformly from to .\n\n
2. Use the acceleration to find the speed after 8 seconds.
After seconds,\n\n
5(c)
1. Interpret the horizontal part of the speed-time graph from 10 s to 30 s.
From to , the speed-time graph is horizontal at speed . Since , the speed is constant at .
The motorcyclist travels at a constant speed of between 10 and 30 seconds.
5(d)
1. Find the decrease in speed per second over the last 25 seconds.
For the last seconds, the speed decreases from to .
5(e)
1. Find the distance travelled by 10 seconds.
From earlier parts, .
Distance travelled from to s is the area of the triangle under the speed-time graph:
So the distance-time graph passes through .
2. Find the distance travelled by 30 seconds.
From to s, the speed is constant at .
Distance travelled in this interval:
Total distance by s:
So the graph passes through .
3. Find the final point and choose the correct shapes of the graph.
The total distance travelled is , and the journey ends at s.
So the final point is .
For the shape:
- From to s, speed increases uniformly, so the distance-time graph has increasing gradient and is concave upwards.
- From to s, speed is constant, so the distance-time graph is a straight line.
- From to s, speed decreases uniformly to , so the distance-time graph has decreasing gradient and is concave downwards, ending horizontal at s.
Sketch a distance-time graph passing through , , and , with:
- an increasing curve, concave upwards, from to s,
- a straight line from to s,
- an increasing curve, concave downwards, from to s, ending with zero gradient at .
AI analysis — may contain mistakes.
Worked this one out on paper? Snap your steps and Gigle's AI math checker will circle the step where it went wrong.
More questions on this topic
- 1Mrs Ang runs a small tuition centre for secondary school students. The tables provide information on the cost of running…
- 2The diagram (not drawn to scale) shows the speed-time graph of a vehicle. The vehicle starts from rest and accelerates u…
- 3Hamid borrowed a sum of money for 3 years at an interest rate of 3.5% per annum simple interest to pay for his car. If t…
- 4The diagram shows the positions of a harbour, H, a lighthouse, L, and two buoys P and Q. HPQ is a straight line. The bea…
- 5The diagram below shows the speed-time graph of a bus journey. The bus accelerated from rest at 1.25 m/s^2 to a speed of…