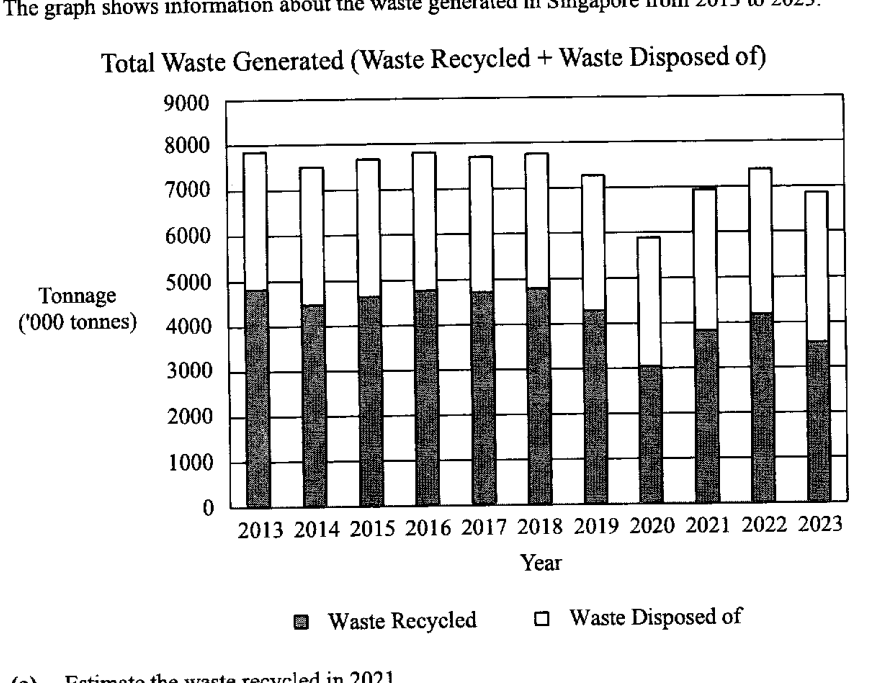
The graph shows information about the waste generated in Singapore from 2013 to 2023. Total Waste Generated (Waste Recycled + Waste Disposed of)
- (a)
Estimate the waste recycled in 2021.
Answer ... tonnes
- (b)
Make one comment about the total waste generated in the 2020s compared with the 2010s.
Answer ...
- (c)
There was a significant drop in the amount of construction and demolition waste, which is usually completely recycled, over the last decade. Brian claims that this contributed to a decline in the percentage of waste recycled in the 2020s compared with the 2010s.
Does the graph support his claim? Justify your answer with reference to the graph.Answer ...
...
It won't just hand you the answer — it asks where you're stuck.How the checker works
Worked solution
15(c)
1. Identify what the graph can show about recycling percentage.
In each stacked bar, the shaded part represents waste recycled. Comparing the shaded part with the total height of the bar gives the approximate percentage recycled.
From the graph, the shaded portion generally forms a smaller fraction of the total in the 2020s than in the 2010s, so the graph suggests a decline in the percentage recycled.
2. Judge whether the graph supports the stated cause.
However, the graph only separates waste into recycled and disposed of. It does not show construction and demolition waste as a separate category.
Therefore, the graph cannot show whether a drop in construction and demolition waste contributed to the decline in recycling percentage.
No, not fully. The graph shows that the proportion of waste recycled appears lower in the 2020s than in the 2010s, but it does not show the amount of construction and demolition waste separately. Hence the graph alone cannot support Brian’s claim that the drop in construction and demolition waste caused the decline in the percentage recycled.
AI analysis — may contain mistakes.
Worked this one out on paper? Snap your steps and Gigle's AI math checker will circle the step where it went wrong.
More questions on this topic
- 1The masses of two batches of 400 steel bars produced by factory A and B were measured and recorded. The cumulative frequ…
- 2The diagram below shows the speed-time graph of a bus journey. The bus accelerated from rest at 1.25 m/s^2 to a speed of…
- 3The stem-and-leaf diagram shows the test scores of the boys and girls from a particular class. [Stem-and-leaf diagram pr…
- 4Explain how the line graph above may be misleading. Answer ...
- 5The graph shows the sales at a particular mall. Explain why the mean sales is not a good indication as a central measure…