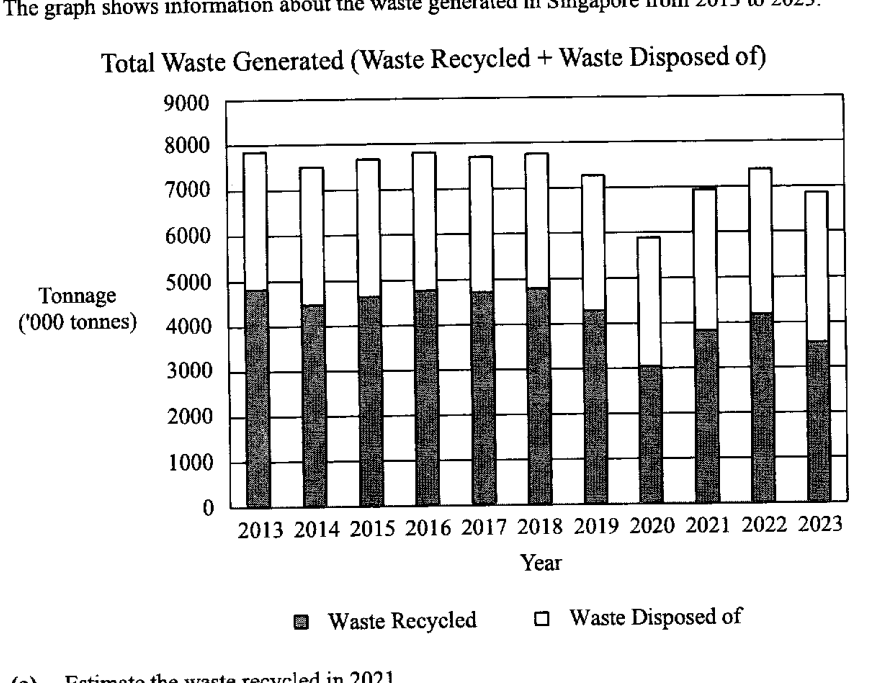
该图表显示了2013年至2023年新加坡产生的垃圾信息。 产生的总垃圾量(回收垃圾量 + 处置垃圾量)
- (a)
估算2021年回收的垃圾量。
答案 ... 吨
- (b)
对2020年代产生的总垃圾量与2010年代进行比较,写出一条评述。
答案 ...
- (c)
在过去十年中,通常会被完全回收的建筑和拆除垃圾的数量显著下降。布莱恩声称,这导致了2020年代回收垃圾所占百分比与2010年代相比有所下降。
该图表支持他的说法吗?请结合图表解释你的答案。答案 ...
...
它不会直接告诉你答案,而是问你卡在哪一步看看 AI 是怎么陪你一步步弄懂这道题的
完整解法
15(c)
1. Identify what the graph can show about recycling percentage.
In each stacked bar, the shaded part represents waste recycled. Comparing the shaded part with the total height of the bar gives the approximate percentage recycled.
From the graph, the shaded portion generally forms a smaller fraction of the total in the 2020s than in the 2010s, so the graph suggests a decline in the percentage recycled.
2. Judge whether the graph supports the stated cause.
However, the graph only separates waste into recycled and disposed of. It does not show construction and demolition waste as a separate category.
Therefore, the graph cannot show whether a drop in construction and demolition waste contributed to the decline in recycling percentage.
No, not fully. The graph shows that the proportion of waste recycled appears lower in the 2020s than in the 2010s, but it does not show the amount of construction and demolition waste separately. Hence the graph alone cannot support Brian’s claim that the drop in construction and demolition waste caused the decline in the percentage recycled.
AI 分析,可能出错
用 AI 批改,圈出写错的那一步,并自动将你的薄弱点存入错题本,形成你的错因库。
同一知识点的其他题
- 1对 A、B 两家工厂生产的两批各 400 根钢条的质量进行了测量和记录。下方的累积频数图像显示了这些质量。 对于工厂 A 生产的钢条,求 中位数。 答案 ... kg 四分位距。 答案 ... kg 工厂 B 生产的钢条比工厂 A 生产的钢…
- 2下图显示了一辆公共汽车行驶过程中的速度-时间图像。 公共汽车在 20 秒内从静止以 1.25 m/s^2 的加速度加速到 v m/s 的速度,并保持该速度行驶到第 T 秒,然后在第 80 秒时停止。 全程行驶的总路程为 1450 m。 求下…
- 3茎叶图显示了某班男生和女生的测试成绩。 [茎叶图印刷为两列,左列标为“男生”(Boys),右列标为“女生”(Girls),共用中间的一列茎。键(男生)8 | 3 表示 38。键(女生)4 | 1 表示 41。] 艾尔文在下方的箱线图中表示了…
- 4解释上面的折线图可能如何产生误导。 答案 ...
- 5该图表显示了某商场的销售额。 解释为什么平均销售额不能很好地作为集中趋势的度量。