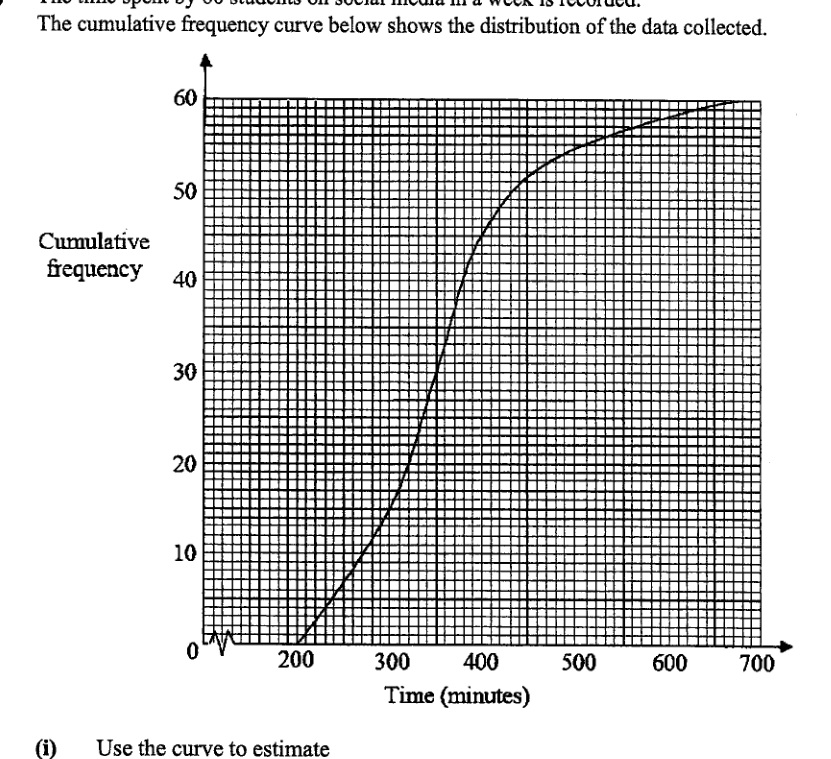
The time spent by 60 students on social media in a week is recorded. The cumulative frequency curve below shows the distribution of the data collected.
- (i)
Use the curve to estimate
- (a)
the median,
Answer ...
- (b)
the interquartile range.
Answer ...
- (a)
- (ii)
20% of the students spent at least x minutes on social media in a week. Find the value of x.
Answer x = ...
- (iii)
Another group of 60 students was found to have the same median but a larger interquartile range. Sketch a possible cumulative frequency curve to represent this distribution on the above grid.
- (8)
- (b)
The table below shows the average amount of time (in minutes) spent daily on social media by a group of 240 students.
- (i)
One of these students is selected at random.
Find, as a fraction in its lowest terms, the probability that the student- (a)
is a girl who spent at most 60 minutes on social media in a day.
Answer ...
- (b)
spent more than 80 minutes on social media in a day.
Answer ...
- (a)
- (ii)
Two students were selected at random.
Find the probability that at least one of them spent less than or equal to 40 minutes on social media in a day.Answer ...
- (i)
- (b)
It won't just hand you the answer — it asks where you're stuck.How the checker works
Worked solution
8 (a)(iii)
1. Identify the median point that must remain unchanged.
Since there are students, the median is the value at cumulative frequency
The new curve must pass through the same point on the horizontal line as the original curve.
2. Ensure the interquartile range is larger than the original distribution.
For students,
A larger interquartile range means
So the new curve should meet at a smaller time than the original curve and meet at a larger time than the original curve.
3. Sketch a valid cumulative frequency curve.
Draw a smooth increasing curve from near cumulative frequency to cumulative frequency . The curve should:
- pass through the same median point as the original curve at ,
- be further to the left of the original curve at ,
- be further to the right of the original curve at ,
- remain non-decreasing throughout.
Sketch an increasing cumulative frequency curve from cumulative frequency to which passes through the same median point as the original curve, i.e. the same time value at cumulative frequency , but has its further to the left and its further to the right than the original curve, giving a larger interquartile range.
8 (a)(8)(b)(i)(a)
1. Identify the number of girls who spent at most 60 minutes and form the probability.
Girls who spent at most minutes are in the classes and .
Number of such girls .
Total number of students .
8 (a)(8)(b)(i)(b)
1. Find the number of students who spent more than 80 minutes and form the probability.
Students who spent more than minutes are in the class .
Number of such students .
Total number of students .
8 (a)(8)(b)(ii)
1. Find the number of students who spent less than or equal to 40 minutes.
From the table, students who spent minutes:
So the number who spent more than minutes is
2. Use the complement probability for at least one student.
Since the students are selected without replacement,
Hence
AI analysis — may contain mistakes.
Worked this one out on paper? Snap your steps and Gigle's AI math checker will circle the step where it went wrong.
More questions on this topic
- 1The masses of two batches of 400 steel bars produced by factory A and B were measured and recorded. The cumulative frequ…
- 2The stem-and-leaf diagram shows the test scores of the boys and girls from a particular class. [Stem-and-leaf diagram pr…
- 3The cumulative frequency graph shows distribution of the waiting times before being served, in minutes, of 60 customers…
- 4The waiting time, t in minutes, for 40 customers at two phone service shops, Shop A and Shop B, are as follows. Calculat…
- 5The temperatures of eighteen girls in a class on a particular day are shown in the stem-and-leaf diagram. (Stem-and-leaf…