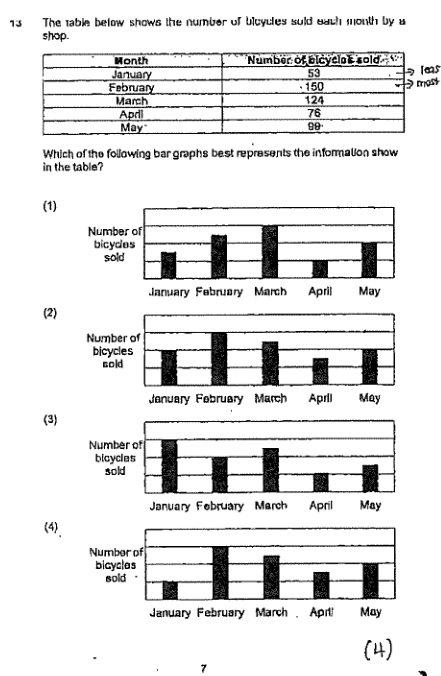
The table below shows the number of bicycles sold each month by a shop. Which of the following bar graphs best represents the information show in the table?
It won't just hand you the answer — it asks where you're stuck.How the checker works
Worked solution
13
1. Identify the relative order of the sales values from the table.
From the table, the sales are:
- January:
- February:
- March:
- April:
- May:
Ordering them from lowest to highest: January () < April () < May () < March () < February ().
2. Evaluate the given graphs against the established order.
We need a graph where the bar heights follow the order: Jan < Apr < May < Mar < Feb.
- Graph (1): May is described as medium, but we need to check if it's higher than April and lower than March. The description says March is medium-high, April is medium-low, May is medium. This could fit, but let's check Graph (4).
- Graph (2): May is higher than March. This contradicts the table ().
- Graph (3): January is high, February is low. This contradicts the table ().
- Graph (4): January is low, February is high, March is medium-high, April is medium-low, May is medium (higher than April but lower than March). This perfectly matches the order Jan < Apr < May < Mar < Feb.
Answer
Graph (4) (option 4)
AI analysis — may contain mistakes.
Worked this one out on paper? Snap your steps and Gigle's AI math checker will circle the step where it went wrong.
More questions on this topic
- 1数学考试甲、乙两名同学的平均分是88分,甲、丙两名同学的平均分是90,乙、丙两名同学的平均分是92,他们三人的平均分是多少分?
- 2刘华参加演讲比赛,个评委的打分分别是:分、分、分、分、分、分、分。如果去掉一个最高分和一个最低分,刘华的平均得分是多少分?
- 3A group of workers was asked to vote for their favourite food, carrot cake, mee siam and nasi lemak. The pie chart shows…
- 4Danny's scores for 5 games are shown in the table below. | Game | 1st | 2nd | 3rd | 4th | 5th | | :--- | :---: | :---: |…
- 5A group of students had an average of $10. Three students with a sum of $57 joined the group and the average amount of…