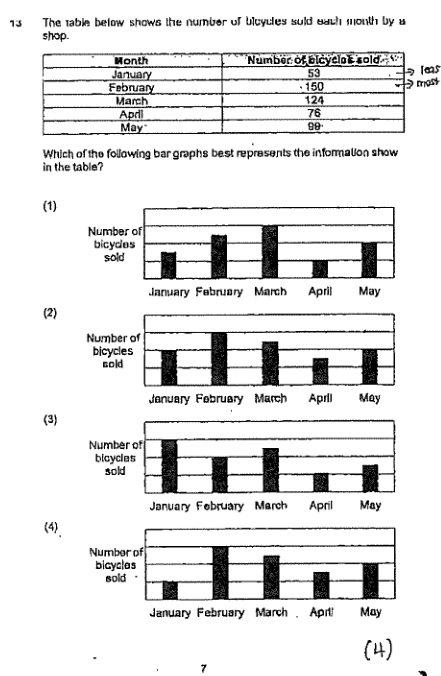
下表显示了一家商店每月售出的自行车数量。 下列哪个条形图最能表示表中显示的信息?
它不会直接告诉你答案,而是问你卡在哪一步看看 AI 是怎么陪你一步步弄懂这道题的
完整解法
13
1. Identify the relative order of the sales values from the table.
From the table, the sales are:
- January:
- February:
- March:
- April:
- May:
Ordering them from lowest to highest: January () < April () < May () < March () < February ().
2. Evaluate the given graphs against the established order.
We need a graph where the bar heights follow the order: Jan < Apr < May < Mar < Feb.
- Graph (1): May is described as medium, but we need to check if it's higher than April and lower than March. The description says March is medium-high, April is medium-low, May is medium. This could fit, but let's check Graph (4).
- Graph (2): May is higher than March. This contradicts the table ().
- Graph (3): January is high, February is low. This contradicts the table ().
- Graph (4): January is low, February is high, March is medium-high, April is medium-low, May is medium (higher than April but lower than March). This perfectly matches the order Jan < Apr < May < Mar < Feb.
答案
Graph (4) (option 4)
AI 分析,可能出错
用 AI 批改,圈出写错的那一步,并自动将你的薄弱点存入错题本,形成你的错因库。
同一知识点的其他题
- 1数学考试甲、乙两名同学的平均分是88分,甲、丙两名同学的平均分是90,乙、丙两名同学的平均分是92,他们三人的平均分是多少分?
- 2刘华参加演讲比赛,个评委的打分分别是:分、分、分、分、分、分、分。如果去掉一个最高分和一个最低分,刘华的平均得分是多少分?
- 3一组工人被要求投票选出他们最喜欢的食物:萝卜糕、米暹(mee siam)和椰浆饭(nasi lemak)。饼图显示了工人们的选择。工人们的选择也由 4 张图表表示。以下哪张图表最能代表饼图中的信息?
- 4丹尼在 5 场比赛中的得分如下表所示。 | 比赛 | 第 1 场 | 第 2 场 | 第 3 场 | 第 4 场 | 第 5 场 | | :--- | :---: | :---: | :---: | :---: | :---: | | 得分…
- 5一群学生平均有 $10。三个总共拥有 $57 的学生加入了该群体,使得每个学生的平均钱数增加了 $3。起初这个群体里有多少名学生? 答:___