The histogram below shows the distribution of the scores of the participants from Potong Pasir Secondary School in a current affairs quiz.
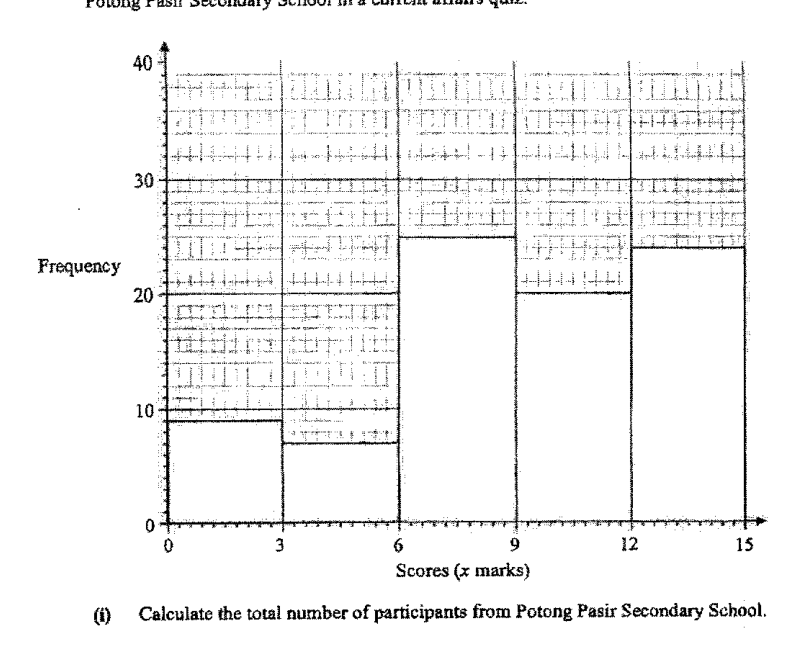
- (i)
Calculate the total number of participants from Potong Pasir Secondary School.
Answer ...
- (ii)
Calculate an estimate of the mean score.
Answer ...
- (iii)
Calculate an estimate of the standard deviation.
Answer ...
- (iv)
Explain why the mean and standard deviation are estimates.
Answer ...
...
- (v)
State the interval that contains the median mark.
Answer ...
- (vi)
The organiser then decides to present the awards for the quiz according to the following table.
Calculate the percentage of students who attained at least a Silver Award.
Answer ...%
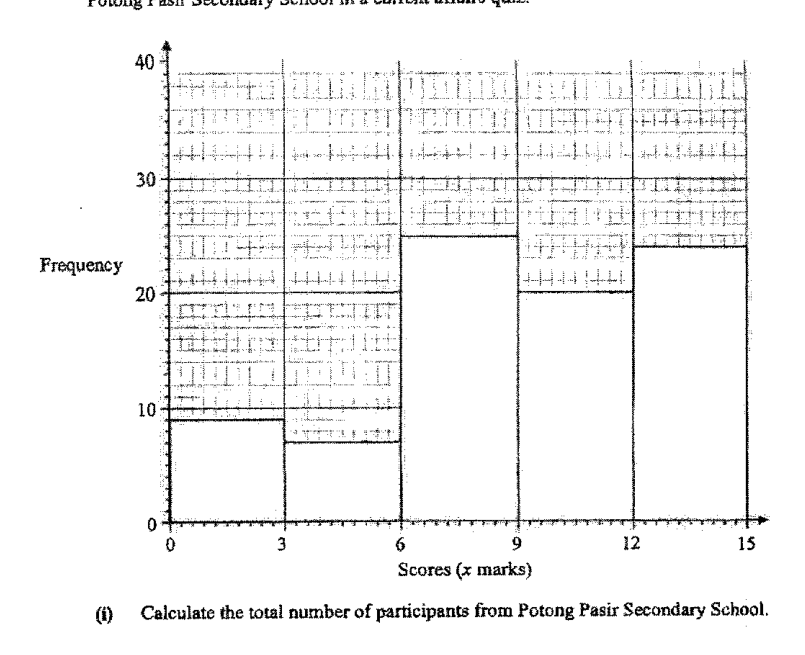
- (b)
Box A contains 3 cups of chocolate ice-cream and 4 cups of strawberry ice-cream.
Box B contains 2 cups of chocolate ice-cream, 3 cups of strawberry ice-cream and 4 cups of vanilla ice-cream.
A cup of ice-cream is selected at random from box A.
It is then placed in box B before a cup of ice-cream is selected at random from box B.- (i)
Draw a tree diagram to show the probabilities of the possible outcomes.
Answer
- (ii)
Find, as a fraction in its simplest form, the probability that
- (a)
the two cups of ice-cream selected are of the same flavour,
Answer ...
- (b)
the second cup of ice-cream selected is not chocolate.
Answer ...
- (a)
- (i)
It won't just hand you the answer — it asks where you're stuck.How the checker works
Worked solution
6(i)
1. Find the total frequency from the histogram
Total number of participants
participants
6(ii)
1. Calculate the estimated mean using midpoints and frequencies from the histogram
Class midpoints: .
Frequencies: .
marks
6(iii)
1. Calculate the estimated standard deviation using midpoints and frequencies
Using the midpoints and frequencies ,
From earlier parts, and .
marks
6(iv)
1. State why the calculated values are not exact
The histogram gives grouped data only, so the exact scores of the participants within each interval are unknown. In calculating the mean and standard deviation, the midpoint of each class interval was used to represent all scores in that interval. Hence the mean and standard deviation are estimates.
The scores are grouped into class intervals, so the actual individual scores are not known. The mean and standard deviation were calculated using the class midpoints, so they are only estimates.
6(v)
1. Find the median position and locate it using cumulative frequencies
Total number of participants .
Median position th value.
Cumulative frequencies:
–:
–:
–:
Since the th value lies between the th and th values, the median mark is in the interval .
6(vi)
1. Find the number of students who attained at least a Silver Award
At least a Silver Award means Silver or Gold.
Silver: , frequency
Gold: , frequency
Number who attained at least Silver
2. Express this number as a percentage of all participants
Total number of participants .
Percentage
6(b)(i)
1. Find the probabilities for the first selection from Box A
Box A contains chocolate and strawberry cups, so the total number of cups is
First branch probabilities:
2. Update Box B and find second-selection probabilities after chocolate is transferred
If a chocolate cup is selected from Box A and placed in Box B, Box B then contains:
Total in Box B:
Second branch probabilities after chocolate from A:
3. Update Box B and find second-selection probabilities after strawberry is transferred
If a strawberry cup is selected from Box A and placed in Box B, Box B then contains:
Total in Box B:
Second branch probabilities after strawberry from A:
Tree diagram probabilities:
-
First selection from Box A:
- Chocolate:
- Strawberry:
-
If Chocolate is selected from Box A, Box B has chocolate, strawberry and vanilla cups, total :
- Chocolate:
- Strawberry:
- Vanilla:
-
If Strawberry is selected from Box A, Box B has chocolate, strawberry and vanilla cups, total :
- Chocolate:
- Strawberry:
- Vanilla:
6(b)(ii)(a)
1. Identify the favourable same-flavour outcomes and multiply along each tree branch
Same flavour can occur in two ways:
2. Add the mutually exclusive favourable probabilities and simplify
6(b)(ii)(b)
1. Identify and calculate the probabilities of all branches where the second cup is not chocolate
The second cup is not chocolate means the second cup is strawberry or vanilla.
Using the tree diagram:
2. Add the favourable probabilities and simplify the fraction
Alternatively, using complements:
AI analysis — may contain mistakes.
Worked this one out on paper? Snap your steps and Gigle's AI math checker will circle the step where it went wrong.
More questions on this topic
- 1The masses of two batches of 400 steel bars produced by factory A and B were measured and recorded. The cumulative frequ…
- 2The diagram below shows the speed-time graph of a bus journey. The bus accelerated from rest at 1.25 m/s^2 to a speed of…
- 3The stem-and-leaf diagram shows the test scores of the boys and girls from a particular class. [Stem-and-leaf diagram pr…
- 4Explain how the line graph above may be misleading. Answer ...
- 5The graph shows the sales at a particular mall. Explain why the mean sales is not a good indication as a central measure…