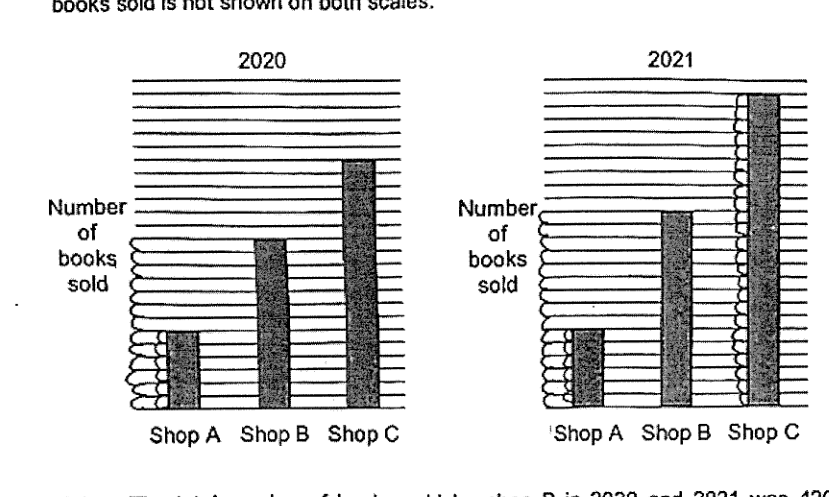
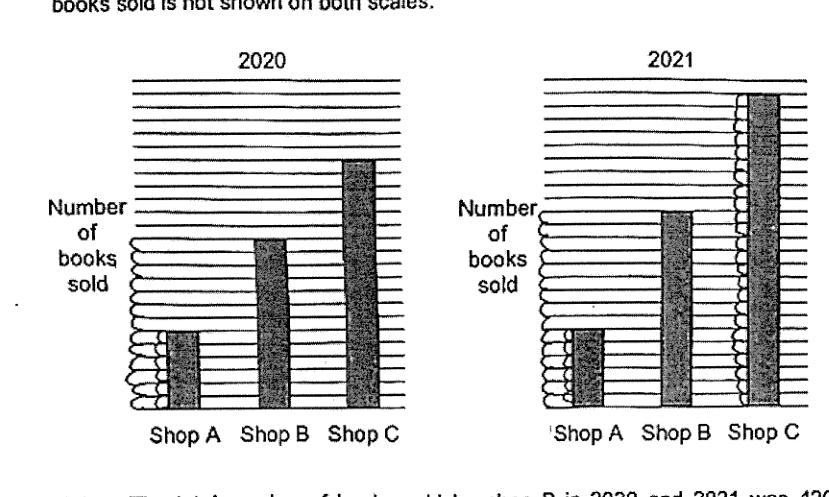
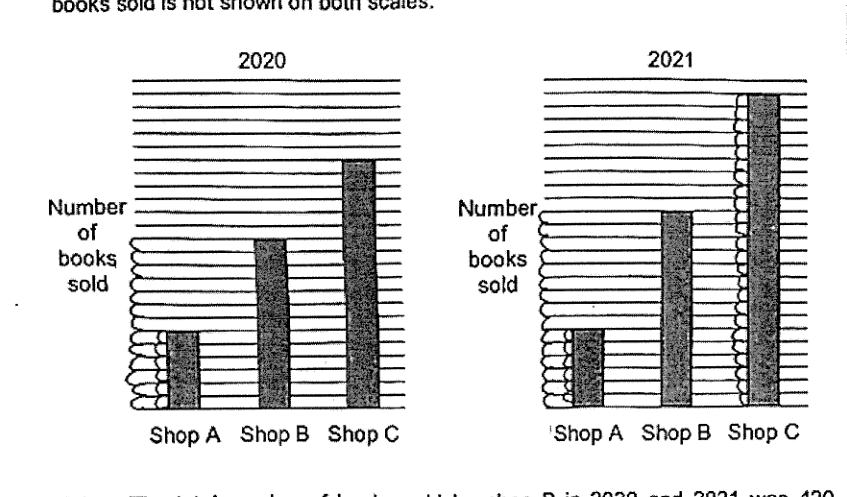
The bar graphs show the number of books sold by shops A, B and C in 2020 and 2021. Shop A sold the same number of books in 2020 and 2021. The number of books sold is not shown on both scales.
- (a)
The total number of books sold by shop B in 2020 and 2021 was 420. How many books did shop A sell in the two years?
- (b)
Shops B and C sold the same number of books in 2022. Shop C had a 25% decrease in the number of books sold from 2021 to 2022. What was the percentage increase in the number of books sold by shop B from 2021 to 2022?
It won't just hand you the answer — it asks where you're stuck.How the checker works
Worked solution
No solution to show yet.
Worked this one out on paper? Snap your steps and Gigle's AI math checker will circle the step where it went wrong.
More questions on this topic
- 1The masses of two batches of 400 steel bars produced by factory A and B were measured and recorded. The cumulative frequ…
- 2The diagram below shows the speed-time graph of a bus journey. The bus accelerated from rest at 1.25 m/s^2 to a speed of…
- 3The stem-and-leaf diagram shows the test scores of the boys and girls from a particular class. [Stem-and-leaf diagram pr…
- 4Explain how the line graph above may be misleading. Answer ...
- 5The graph shows the sales at a particular mall. Explain why the mean sales is not a good indication as a central measure…