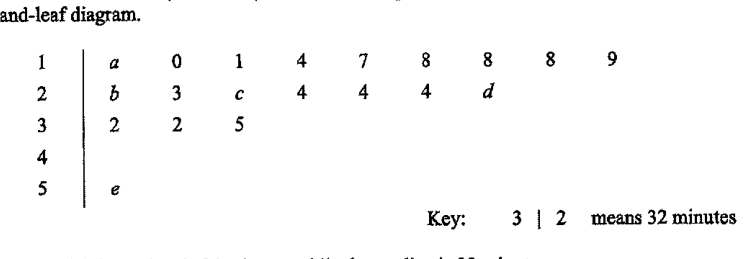
20 female shoppers went to buy their groceries. The amount of time (in minutes) each female shopper spent is shown in the stem-and-leaf diagram.
- ((i))
State the values of a, b, c, d and e.
Answer a = ... , b = ... , c = ... , d = ... , e = ...
- ((ii))
20 male shoppers went to buy their groceries. The interquartile range of the time spent by the male shoppers was 4.5 minutes.
Use this information to make one comment comparing the time spent by the male and female shoppers.
Answer ...
...
- ((iii))
The standard deviation of the time taken by the male shoppers was 4.53 minutes. Given that the sum of the squared timings of the 20 male shoppers was 9050, find the mean time of the male shoppers for their grocery trip.
Answer ... minutes
It won't just hand you the answer — it asks where you're stuck.How the checker works
Worked solution
2((i))
1. Use the modal time to identify the missing leaf in the 20s row
The modal time is minutes, so must occur more often than any other time.
In the stem row, the leaves are
There are already three s, while occurs three times in the stem row. Hence one more is needed.
So .
2. Use the median and the two 23-minute shoppers to identify the remaining missing leaves in the 20s row
There are shoppers, so the median is the average of the th and th values.
There are values in the stem row, so the th and th values are the first two values in the stem row.
Since the median is minutes,
As a leaf in the stem row, this means .
Two shoppers spent minutes. One leaf is already shown in the stem row, so the other missing must be .
3. Use ordering and range to identify the smallest and largest values
The leaves in each row are in ascending order. In the stem row,
so must be less than or equal to . Since leaves are digits, .
The smallest value is therefore minutes.
The range is minutes, so
The largest value is in the stem row, so .
2((ii))
1. Find the lower and upper quartiles for the female shoppers
From part (i), the ordered female times are
.
For values,
is the median of the first values:
is the median of the last values:
2. Compare the female interquartile range with the male interquartile range
Female interquartile range:
Male interquartile range minutes.
Since , the female shoppers' times have a greater spread in the middle of the data.
The female shoppers' times are more spread out than the male shoppers' times, since their interquartile range is minutes compared with minutes for the male shoppers.
2((iii))
1. Substitute the given values into the standard deviation formula
For , and standard deviation ,
2. Solve the equation for the mean time
So the mean time is minutes, to 3 significant figures.
minutes
AI analysis — may contain mistakes.
Worked this one out on paper? Snap your steps and Gigle's AI math checker will circle the step where it went wrong.
More questions on this topic
- 1The masses of two batches of 400 steel bars produced by factory A and B were measured and recorded. The cumulative frequ…
- 2The diagram below shows the speed-time graph of a bus journey. The bus accelerated from rest at 1.25 m/s^2 to a speed of…
- 3The stem-and-leaf diagram shows the test scores of the boys and girls from a particular class. [Stem-and-leaf diagram pr…
- 4Explain how the line graph above may be misleading. Answer ...
- 5The graph shows the sales at a particular mall. Explain why the mean sales is not a good indication as a central measure…