The graph of is given above. Sketch, on separate diagrams, the graphs of Your sketches should show clearly the coordinates of any stationary points, axial intercepts and the equations of any asymptotes.
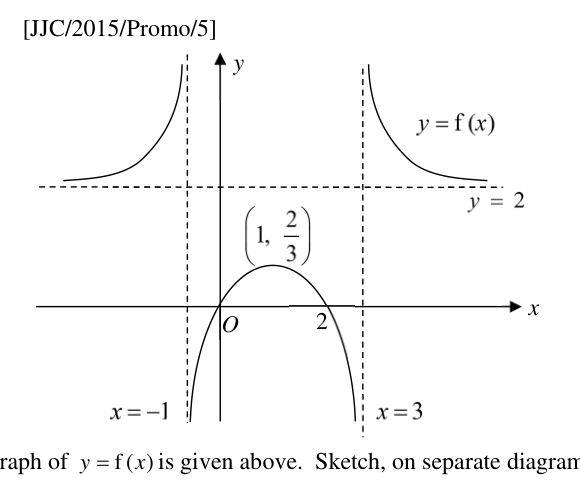
- (i)
,
- (ii)
,
- (iii)
.
It won't just hand you the answer — it asks where you're stuck.How the checker works
Worked solution
5(i)
1. Establish the coordinate mapping for the transformation
The transformation from to maps each point on the original graph to a new point .
The relationship between the -coordinates is given by:
2. Determine the new equations of the asymptotes
- Vertical asymptote
- Vertical asymptote
- The horizontal asymptote is unaffected by horizontal transformations, so it remains .
3. Calculate the new coordinates of the stationary point and intercepts
- The -intercept at . The new intercept is .
- The -intercept at . The new intercept is .
- The local maximum at . The new stationary point is .
Note: Since is now a vertical asymptote, there is no -intercept.
A sketch showing three branches with:
- Vertical asymptotes: and (the -axis)
- Horizontal asymptote:
- -intercepts at and
- Local maximum point at
5(ii)
1. Deduce the equations of the asymptotes for the derivative graph.
As , the graph of approaches the horizontal asymptote , meaning the gradient flattens out and approaches . Hence, the horizontal asymptote for is .
As and , the graph of approaches vertical asymptotes, so the curve becomes infinitely steep. Hence, the vertical asymptotes remain and .
2. Identify the x-intercept of the derivative graph from the stationary point of f(x).
The graph of has a local maximum (stationary point) at . At this maximum turning point, the gradient of the tangent is .
Hence, has an -intercept at .
3. Determine the sign and behaviour of the derivative graph in each region to complete the sketch.
Analyse the gradient of across the three intervals:
- For : is increasing, so . The gradient increases from (at ) to (near ).
- For : is increasing from , so . The gradient decreases from steepest at (near ) to (at ).
- For : is decreasing towards , so . The gradient becomes increasingly negative, dropping from to (near ).
- For : is decreasing from , so . The gradient starts very steep at (near ) and becomes less steep, approaching (at ).
The concavity of does not change sign within any of the three branches, meaning there are no stationary points for . Sketch the three branches satisfying these gradient changes.
A correct sketch of must include:
- Horizontal Asymptote:
- Vertical Asymptotes: and
- Axial Intercept:
- Left branch (): A curve above the -axis, increasing from to approach the asymptote upwards.
- Middle branch (): A curve decreasing continuously from the top of , passing through the positive -axis and the -axis at , and approaching the bottom of .
- Right branch (): A curve below the -axis, increasing from the bottom of to approach from below.
5(iii)
1. Find the vertical asymptotes and $x$-intercepts of the reciprocal graph
The -intercepts of occur at and . These become vertical asymptotes for , yielding the lines and .
The vertical asymptotes of are and . As and , , which means . Thus, has -intercepts at and .
2. Find the new horizontal asymptote and stationary point
The horizontal asymptote of is . Therefore, the horizontal asymptote of the reciprocal graph is .
The local maximum point of is . Since taking the reciprocal of positive values inverses the nature of the stationary point, will have a local minimum at .
3. Determine the limits and asymptotic behaviour to shape the branches
For and , is positive and greater than (approaching as ). Thus, is positive, less than , and approaches the horizontal asymptote from below.
Between the vertical asymptotes and , changes sign as it passes through and . Consequently:
- As ,
- As ,
This shows the curve cuts through smoothly. A similar crossing from negative to positive occurs at .
A sketch of the graph showing:
- Vertical asymptotes at (the -axis) and .
- A horizontal asymptote at .
- -intercepts at and .
- A local minimum point at .
The curve consists of three continuous branches bounded by the vertical asymptotes:
- For , it approaches from below as , passes down through , and tends to as .
- For , a U-shaped curve tending to as it approaches the vertical asymptotes and , passing through the local minimum at .
- For , it emerges from as , passes up through , and approaches from below as .
AI analysis — may contain mistakes.
Worked this one out on paper? Snap your steps and Gigle's AI math checker will circle the step where it went wrong.
More questions on this topic
- 1将函数的图象保持纵坐标不变,先将横坐标缩短为原来的,再向右平移个单位长度后得到,则的解析式为…
- 2By expressing the equation of the curve in the form , where …
- 3A curve has the equation where . Sketch , stating the coordinates of any points o…
- 4The diagram shows the graphs of and . The graph of has t…
- 5The curve with equation is transformed to curve by a translation of …