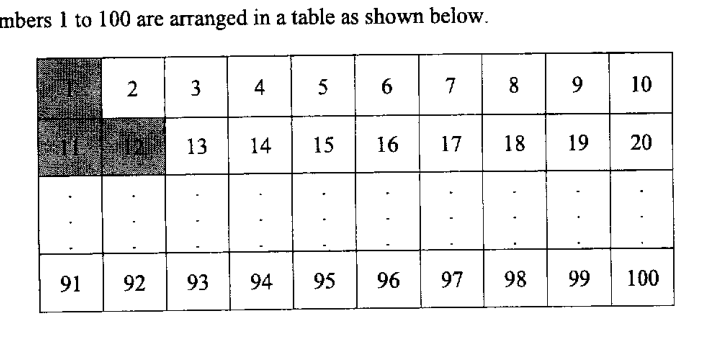
The numbers 1 to 100 are arranged in a table as shown below. A L-shaped shaded frame can be placed around various numbers throughout the table. is used to refer to the shaded frame that is drawn around a particular number. For example, refers to the shaded frame shown above drawn around the number 2.
- (a)
State the largest .
Answer n = ...
- (b)
Write and simplify an expression, in terms of , for the sum of the numbers in .
Answer ...
- (c)
Explain why the sum of the numbers is always a multiple of 3.
Answer ...
It won't just hand you the answer — it asks where you're stuck.How the checker works
Worked solution
17(a)
1. Identify the largest possible corner position for the same L-shaped frame to fit in the table
The L-shaped frame shown for has its corner at the number and extends to the right edge and the bottom edge of the by table.
If the corner were placed further to the right, the horizontal arm would go beyond the table. Hence the largest possible value of is
17(b)
1. Write the sums of the horizontal and vertical arms of $L_n$
Since the L-frame has the same size as the example, the horizontal arm has 9 consecutive numbers:
The vertical arm has 10 numbers increasing by 10:
2. Add the two arm sums, count the corner once only, and simplify
The corner number is included in both arms, so subtract it once.
17(c)
1. Show that the expression for the sum has a factor of 3
From part (b), the sum is
.
Since
,
the sum is always divisible by 3.
, so the sum is always a multiple of 3.
AI analysis — may contain mistakes.
Worked this one out on paper? Snap your steps and Gigle's AI math checker will circle the step where it went wrong.
More questions on this topic
- 1The masses of two batches of 400 steel bars produced by factory A and B were measured and recorded. The cumulative frequ…
- 2The diagram below shows the speed-time graph of a bus journey. The bus accelerated from rest at 1.25 m/s^2 to a speed of…
- 3The stem-and-leaf diagram shows the test scores of the boys and girls from a particular class. [Stem-and-leaf diagram pr…
- 4Explain how the line graph above may be misleading. Answer ...
- 5The graph shows the sales at a particular mall. Explain why the mean sales is not a good indication as a central measure…