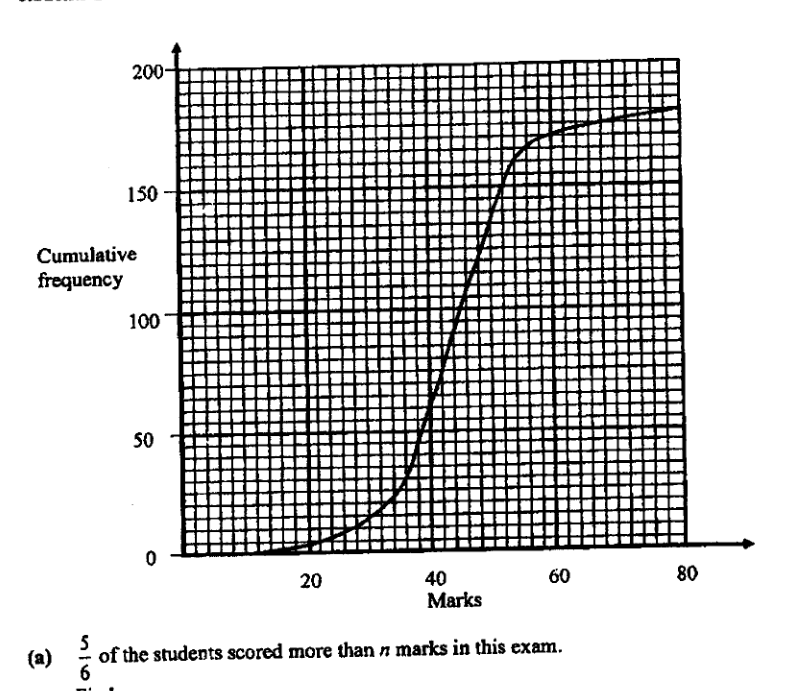
The cumulative frequency curve shows the distribution of marks scored by 180 students in a Mathematics examination in 2021. The maximum possible mark is 80.
- (a)
of the students scored more than marks in this exam.
Find .
Answer ___
- (b)
To obtain the final mark of each student, the teacher divided the mark on the cumulative frequency curve by 2 and added the result by 15.
Find the number of students who had the final mark of 37 or less.
Answer___
- (c)
The marks scored by another group of 180 students in the same mathematics examination has the same median but a larger standard deviation. Describe how the cumulative frequency curve for the new group of students will differ from that of the first group of students.
Answer ___
- (d)
Two of the students are chosen at random.
Find the probability that one of the students scored less than or equal to 60 marks while the other student scored more than 60 marks.Answer ___
It won't just hand you the answer — it asks where you're stuck.How the checker works
Worked solution
18(a)
1. Find the number of students who scored less than or equal to $n$ marks.
Since of the students scored more than marks, the fraction who scored less than or equal to marks is
Number of students scoring marks:
2. Read the mark corresponding to cumulative frequency 30 from the ogive.
On the cumulative frequency curve, draw a horizontal line from cumulative frequency to the curve, then draw a vertical line down to the marks axis.
From the graph,
marks
18(b)
1. Find the original examination mark corresponding to a final mark of $37$.
Let the original mark be .
Final mark .
For a final mark of :
So students with final mark or less had original marks or less.
2. Read the cumulative frequency for marks less than or equal to $44$ from the ogive.
From the cumulative frequency curve, at marks, the cumulative frequency is approximately
Hence, the number of students with final mark or less is approximately .
Approximately students
18(c)
1. Relate the same median to the cumulative frequency curve.
There are students, so the median is at cumulative frequency
Since the new group has the same median, its cumulative frequency curve passes through the same mark at cumulative frequency .
2. Describe the effect of a larger standard deviation on the curve.
A larger standard deviation means the marks are more spread out from the median. Hence the cumulative frequency curve for the new group will be more stretched horizontally and less steep around the middle, while keeping the same median point.
The new cumulative frequency curve passes through the same median point, but is more spread out horizontally / less steep near the middle than the first curve.
18(d)
1. Find the number of students in each mark category.
From the cumulative frequency curve, the number of students who scored marks or less is approximately .
Total number of students .
Number who scored more than marks:
2. Find the probability of choosing one student from each category.
The two students are chosen without replacement.
Required probability:
, or approximately
AI analysis — may contain mistakes.
Worked this one out on paper? Snap your steps and Gigle's AI math checker will circle the step where it went wrong.
More questions on this topic
- 1The masses of two batches of 400 steel bars produced by factory A and B were measured and recorded. The cumulative frequ…
- 2The diagram below shows the speed-time graph of a bus journey. The bus accelerated from rest at 1.25 m/s^2 to a speed of…
- 3The stem-and-leaf diagram shows the test scores of the boys and girls from a particular class. [Stem-and-leaf diagram pr…
- 4Explain how the line graph above may be misleading. Answer ...
- 5The graph shows the sales at a particular mall. Explain why the mean sales is not a good indication as a central measure…