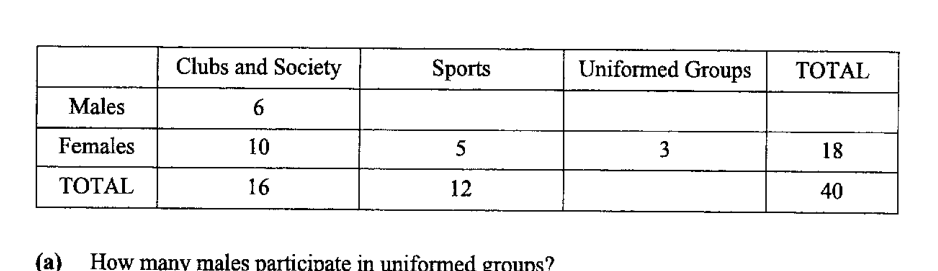
The students in a school participate in exactly one CCA each. The table shows information on the type of CCA which students in a class participate in.
- (a)
How many males participate in uniformed groups?
Answer ...
- (b)
A pie chart is to be drawn showing the data for the females.
Calculate the angle representing females participating in uniformed groups.Answer ...
It won't just hand you the answer — it asks where you're stuck.How the checker works
Worked solution
7(a)
1. Find the number of males in uniformed groups using the table totals
Total in Uniformed Groups:
Males in Uniformed Groups:
Answer
7(b)
1. Calculate the pie chart angle for females in uniformed groups
Females in uniformed groups and total females .
Answer
AI analysis — may contain mistakes.
Worked this one out on paper? Snap your steps and Gigle's AI math checker will circle the step where it went wrong.
More questions on this topic
- 1The masses of two batches of 400 steel bars produced by factory A and B were measured and recorded. The cumulative frequ…
- 2The diagram below shows the speed-time graph of a bus journey. The bus accelerated from rest at 1.25 m/s^2 to a speed of…
- 3The stem-and-leaf diagram shows the test scores of the boys and girls from a particular class. [Stem-and-leaf diagram pr…
- 4Explain how the line graph above may be misleading. Answer ...
- 5The graph shows the sales at a particular mall. Explain why the mean sales is not a good indication as a central measure…