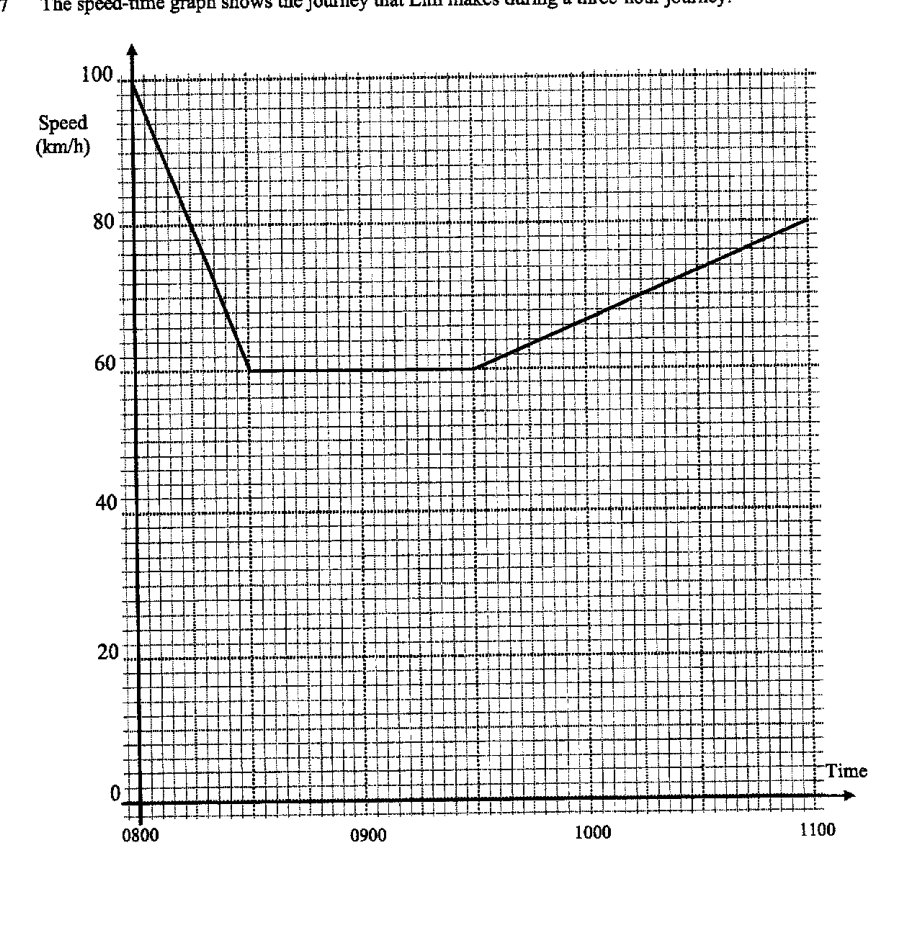
The speed-time graph shows the journey that Lim makes during a three-hour journey.
- (a)
Find the acceleration at 0815.
Answer ___ km/h^2
- (b)
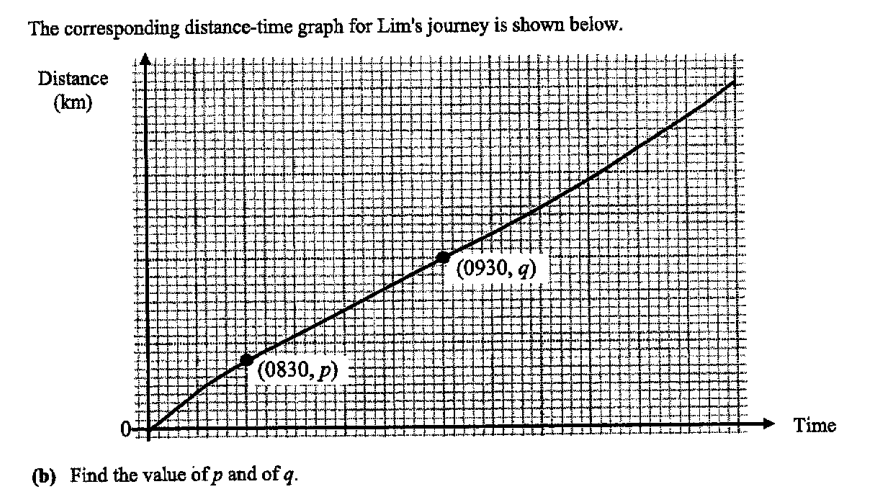
The corresponding distance-time graph for Lim's journey is shown below.
Find the value of p and of q.
Answer p = ___, q = ___
It won't just hand you the answer — it asks where you're stuck.How the checker works
Worked solution
17(a)
1. Find the gradient of the speed-time graph segment containing 0815
From 0800 to 0830, the speed decreases from km/h to km/h.
Time taken min h.
17(b)
1. Find the distance travelled from 0800 to 0830 to get $p$
From 0800 to 0830, the time taken is .\n\nThe distance is the area of the trapezium under the speed-time graph:\n
2. Add the distance travelled from 0830 to 0930 to get $q$
From 0830 to 0930, the speed is constant at for .\n\nDistance travelled in this interval:\n\n\nHence\n
AI analysis — may contain mistakes.
Worked this one out on paper? Snap your steps and Gigle's AI math checker will circle the step where it went wrong.
More questions on this topic
- 1The diagram (not drawn to scale) shows the speed-time graph of a vehicle. The vehicle starts from rest and accelerates u…
- 2The diagram below shows the speed-time graph of a bus journey. The bus accelerated from rest at 1.25 m/s^2 to a speed of…
- 3如果一次函数是常数,的图象过点,那么的值随的增大而___填“增大”或“减小”.
- 4The variables x and y are connected by the equation . Some corresponding values of x and y are g…
- 5The diagram below shows the speed-time graph of a car's journey. For this journey, calculate the acceleration during the…