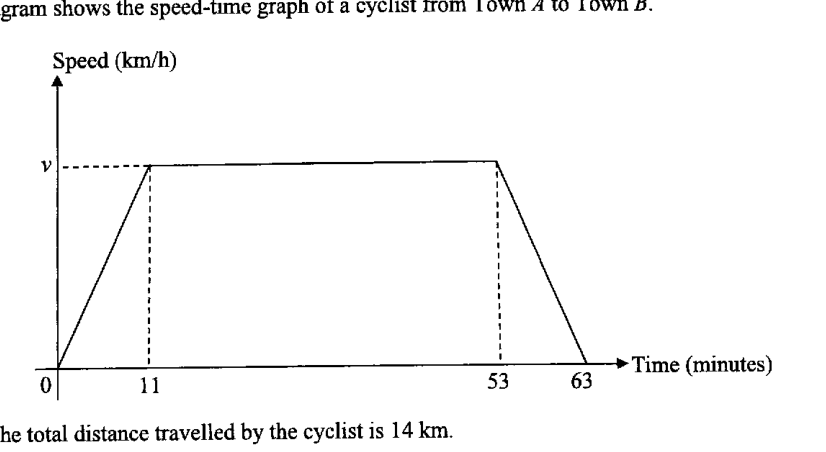
The diagram shows the speed-time graph of a cyclist from Town A to Town B.
- (a)
The total distance travelled by the cyclist is 14 km.
Show that .Answer
- (b)
Find the speed of the cyclist 5 minutes from the start of the journey.
Answer ... km/h
- (c)
Calculate the acceleration of the car in the last 10 minutes.
Answer ... km/h^2
It won't just hand you the answer — it asks where you're stuck.How the checker works
Worked solution
18(a)
1. Express the total distance as the area under the speed-time graph
The distance travelled is the area under the speed-time graph.
The graph consists of two triangles and one rectangle:
2. Solve the resulting linear equation for $v$
Hence, .
18(b)
1. Find the speed at $t=5$ minutes using linear proportion
From part (a), .
In the first minutes, the speed increases linearly from to km/h.
At minutes,
km/h
18(c)
1. Calculate the acceleration as change in speed divided by change in time
In the last 10 minutes, the speed decreases from km/h to km/h.
minutes h.
AI analysis — may contain mistakes.
Worked this one out on paper? Snap your steps and Gigle's AI math checker will circle the step where it went wrong.
More questions on this topic
- 1Mrs Ang runs a small tuition centre for secondary school students. The tables provide information on the cost of running…
- 2The diagram (not drawn to scale) shows the speed-time graph of a vehicle. The vehicle starts from rest and accelerates u…
- 3Hamid borrowed a sum of money for 3 years at an interest rate of 3.5% per annum simple interest to pay for his car. If t…
- 4The diagram shows the positions of a harbour, H, a lighthouse, L, and two buoys P and Q. HPQ is a straight line. The bea…
- 5The diagram below shows the speed-time graph of a bus journey. The bus accelerated from rest at 1.25 m/s^2 to a speed of…