The diagram below shows the graph of . The curve passes through the -axis at and , and has a maximum point with coordinates . The lines and are asymptotes to the graph. Stating the equations of any asymptotes and the coordinates of any points of intersection with the axes and stationary points, where possible, sketch the graphs of
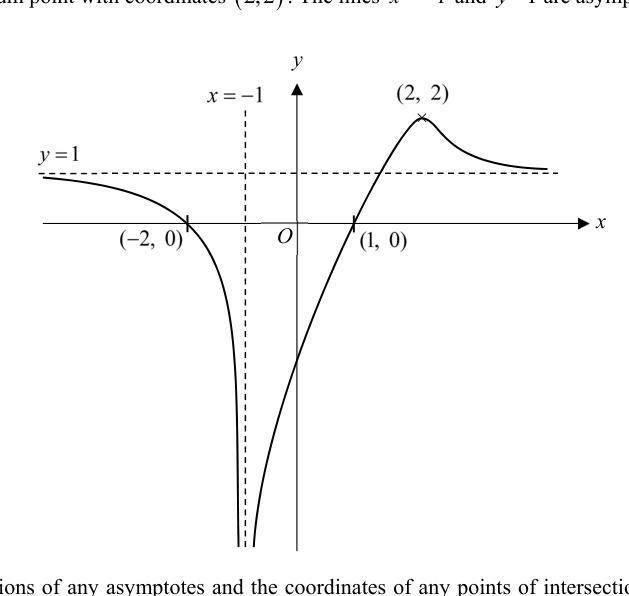
- (a)
, where is a positive constant such that ,
- (b)
.
It won't just hand you the answer — it asks where you're stuck.How the checker works
Worked solution
2(a)
1. Identify the geometrical transformations required
The equation indicates two transformations on the graph of :
- A translation by units in the negative -direction (shift left by ).
- A vertical stretch by a scale factor of parallel to the -axis.
2. Find the equations of the new asymptotes
Original vertical asymptote:
Translated left by :
Original horizontal asymptote:
Stretched vertically by 3:
3. Find the coordinates of the new stationary point
Original maximum point:
Translated left by and stretched vertically by 3:
Since , we have , so the new maximum point lies in the first quadrant.
4. Determine the new intersections with the axes
Original -intercepts: and
Translated left by (vertical stretch does not affect -intercepts):
Since , we have , meaning both -intercepts lie on the negative -axis.
The new -intercept occurs at , giving . From the original graph, for , . Hence , and the curve intersects the positive -axis (the exact coordinate cannot be determined).
5. Sketch the final transformed graph
Sketch the two branches based on the transformed features:
- Left branch: Bounded by and , passing through .
- Right branch: Starts near the bottom of , crosses the -axis at , crosses the positive -axis, peaks at the maximum , and approaches from above as .
Sketch Features:
- Shape: Two branches similar to .
- Asymptotes: Vertical line and horizontal line .
- Axes Intersections: -intercepts at and . The graph intersects the positive -axis.
- Stationary Point: Maximum point at .
2(b)
1. Determine the equations of the asymptotes for $y = \text{f}'(x)$.
Since the graph of has a vertical asymptote at , the gradient is undefined and its magnitude approaches infinity. Thus, is a vertical asymptote for .
As , the curve approaches the horizontal asymptote , meaning the curve flattens out and the gradient approaches . Thus, (the -axis) is a horizontal asymptote for .
2. Determine the coordinates of intersection with the axes.
At the maximum point on , the gradient is . Therefore, , giving an -intercept at .
The exact -intercept cannot be calculated from the given information, but it must be positive since is strictly increasing at .
3. Analyse the sign of the gradient in each interval to deduce the shape of the derivative graph.
For , is strictly decreasing, so . The curve comes from as and plunges to as .
For , is strictly increasing, so . The curve falls from as , and decreases to cross the -axis at .
For , is strictly decreasing, so . The curve dips below the -axis. Since it must approach the horizontal asymptote as , it must reach a local minimum point before turning upwards. (The exact coordinates of this minimum cannot be determined).
Asymptotes: ,
Points of intersection: on the -axis. (The exact -intercept cannot be determined, but must be plotted as positive).
Stationary points: A local minimum exists for some (exact coordinates cannot be determined).
Sketch instructions:
- Left branch (): Drawn entirely below the -axis. Approaches from below as , and approaches going towards .
- Right branch (): Comes down from near , crosses the -axis at a positive value, crosses the -axis at , reaches a local minimum (with a negative -value), and curves back up to approach from below as .
AI analysis — may contain mistakes.
Worked this one out on paper? Snap your steps and Gigle's AI math checker will circle the step where it went wrong.
More questions on this topic
- 1将函数的图象保持纵坐标不变,先将横坐标缩短为原来的,再向右平移个单位长度后得到,则的解析式为…
- 2By expressing the equation of the curve in the form , where …
- 3A curve has the equation where . Sketch , stating the coordinates of any points o…
- 4The diagram shows the graphs of and . The graph of has t…
- 5The curve with equation is transformed to curve by a translation of …