The masses, in grams, of 200 apples of each of variety A and variety B are recorded. The cumulative frequency curves show the distributions of their masses.
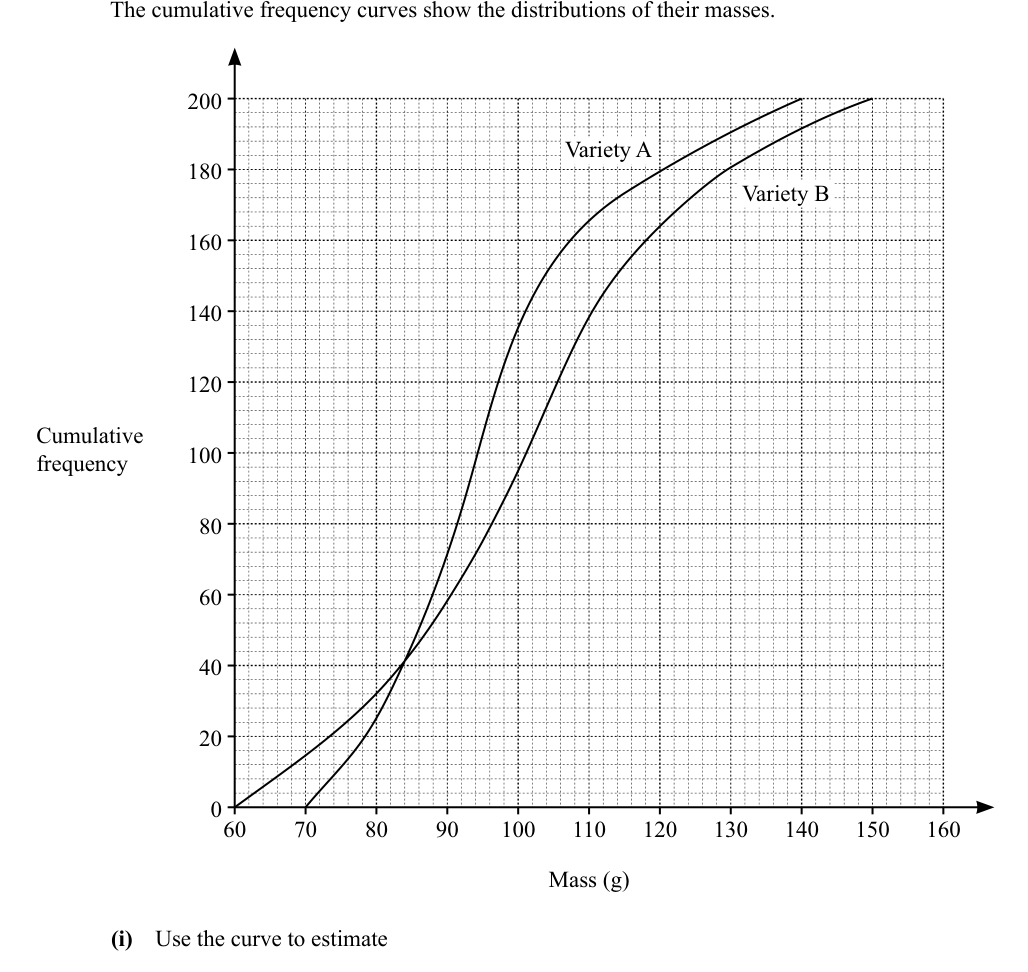
- (i)
Use the curve to estimate
- (a)
the median mass for variety A,
Answer ... g
- (b)
the 60th percentile for variety B,
Answer ... g
- (c)
the interquartile range for variety B.
Answer ... g
- (a)
- (ii)
George sells apples in packs of 6.
He uses apples with a mass between 80 g and 120 g and rejects the rest.Which variety of apples would be better for George to use? Justify your answer using appropriate figures.
... because ...
...
It won't just hand you the answer — it asks where you're stuck.How the checker works
Worked solution
No solution to show yet.
Worked this one out on paper? Snap your steps and Gigle's AI math checker will circle the step where it went wrong.
More questions on this topic
- 1The masses of two batches of 400 steel bars produced by factory A and B were measured and recorded. The cumulative frequ…
- 2The diagram below shows the speed-time graph of a bus journey. The bus accelerated from rest at 1.25 m/s^2 to a speed of…
- 3The stem-and-leaf diagram shows the test scores of the boys and girls from a particular class. [Stem-and-leaf diagram pr…
- 4Explain how the line graph above may be misleading. Answer ...
- 5The graph shows the sales at a particular mall. Explain why the mean sales is not a good indication as a central measure…