下表显示了一个小镇的人口 (以千为单位)随时间 (年)减少的情况。
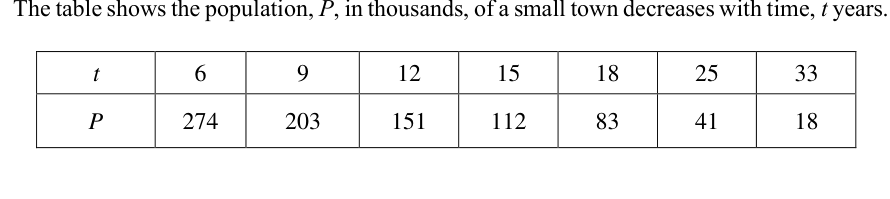
- ((a))
清晰地写出计算步骤,并在所提供的网格上绘制 关于 的直线图。
- ((b))
求你所画直线的斜率,并由此将 表示为 的形式,其中 和 是常数,分别将答案精确到最接近的百位数和保留 1 位小数。
- ((c))
如果该人口模型依然有效,求该小镇的人口下降到 100,000 以下所需的时间(年)。将你的答案精确到最接近的年份。
它不会直接告诉你答案,而是问你卡在哪一步看看 AI 是怎么陪你一步步弄懂这道题的
完整解法
8((a))
1. Calculate the values of $\ln P$ for each corresponding value of $t$ to 2 decimal places.
For ,
For ,
For ,
For ,
For ,
For ,
For ,
| 6 | 9 | 12 | 15 | 18 | 25 | 33 | |
|---|---|---|---|---|---|---|---|
| 5.61 | 5.31 | 5.02 | 4.72 | 4.42 | 3.71 | 2.89 |
2. Plot the points $(t, \ln P)$ on the given grid and draw a straight line of best fit.
Plot the coordinates , , , , , , and on the grid with on the horizontal axis and on the vertical axis. Draw a straight line passing through these points.
Table of values for :
| 6 | 9 | 12 | 15 | 18 | 25 | 33 | |
|---|---|---|---|---|---|---|---|
| 5.61 | 5.31 | 5.02 | 4.72 | 4.42 | 3.71 | 2.89 |
(A straight line graph is drawn passing through these points on the provided grid.)
8((b))
1. Calculate the gradient of the straight line graph of $\ln P$ against $t$
Using the points and from the table:
Gradient
Gradient (to 1 d.p.)
2. Relate the given non-linear equation to the linear form
Taking natural logarithms on both sides:
This is in the form , where , , gradient , and vertical intercept .
3. Find the value of $k$
Since :
(to 1 d.p.)
4. Find the value of $A$ and state the final equation
Using the point to find the intercept :
(to the nearest hundred)
Therefore, .
Gradient ,
8((c))
1. Set up the inequality or equation using the model from part (b)
From part (b), the model is .
Since is in thousands, a population of corresponds to .
We require :
2. Solve for $t$
3. State the final answer to the nearest year
To the nearest year, .
years
AI 分析,可能出错
用 AI 批改,圈出写错的那一步,并自动将你的薄弱点存入错题本,形成你的错因库。
同一知识点的其他题
- 1放射性物质的质量 毫克随着时间 小时而减少。测得的 和 的值见下表。 | t (小时) | 2 | 4 | 6 | 8 | 10 | |---|---:|---:|---:|---:|---:| | m (毫…
- 2药物通过注射方式输入病人体内。经过时间 小时后,病人体内的药物浓度 mg/ 满足以下方程: 其中 和 是常数。下表记录了 和 的一些数值:…
- 3下表显示了两个变量 和 的实验值。 | | 2 | 4 | 6 | 8 | |---|---|---|---|---| | | 2.25 | 0.81 | 0.47 | 0.33 | 在坐标纸上,绘制 …
- 4下表给出了 和 的测量值。 | | 1.2 | 1.6 | 2.0 | 2.6 | 3.5 | 4.5 | |---|---|---|---|---|---|---| | | 11.1 | 6.29 | 3.…
- 5下表显示了 和 的实验值。 | | 2 | 3 | 4 | 5 | 6 | |---|---|---|---|---|---| | | 11.8 | 16.2 | 23.5 | 35.5 | 55.2 | 已…